效果图:
<div style=" 462px; height: 180px" id="teachingRightCenter"></div>
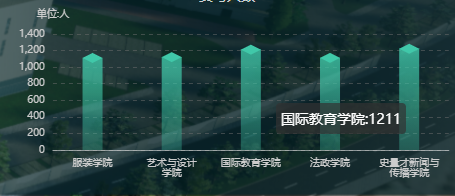
 // 自适应字体大小变化
    WidthAdaptive(res) {
      var windth = window.innerWidth;
      let fontSize = windth / 1920;
      return fontSize * res;
    },
    drawLine() {
      // 基于准备好的dom,初始化echarts实例
      let myChart = this.$echarts.init(
        document.getElementById("teachingRightCenter")
      );
      let categoryData = [
        "服装学院",
        "艺术与设计" + "
" + "学院",
        "国际教育学院",
        "法政学院",
        "史量才新闻与" + "
" + "传播学院",
      ];
      let chartdata = [1111, 1121, 1211, 1112, 1222];

      let option = {
        backgroundColor: "transparent",
        textStyle: {
          color: "#c0c3cd",
          fontSize: this.WidthAdaptive(10),
        },

        color: ["rgba(64, 200, 169, 1)", "rgba(64, 200, 169, 1)"],
        grid: {
          containLabel: true,
          left: "5%",
          right: "2%",
          bottom: "5%",
          top: "15%",
        },
        xAxis: {
          axisLabel: {
            color: "#cccccc",
            fontSize: this.WidthAdaptive(10),
            interval: 0,
          },
          axisTick: {
            show: false,
            lineStyle: {
              color: "#384267",
               1,
            },
          },
          splitLine: {
            show: false,
          },
          axisLine: {
            lineStyle: {
              color: "rgba(255, 255, 255, .5)",
            },
            show: true,
          },
          data: categoryData,
          type: "category",
        },
        yAxis: {
          name: "单位:人",
          nameTextStyle: {
            color: " #cccccc",
            fontSize: this.WidthAdaptive(10),
            padding: 0,
          },
          axisLabel: {
            color: "#cccccc",
            fontSize: this.WidthAdaptive(10),
          },
          axisTick: {
            lineStyle: {
              color: "#668092",
               1,
            },
            show: false,
          },
          splitLine: {
            lineStyle: {
              type: "dashed",
              color: "rgba(112,112,112,0.5)",
            },
          },
          axisLine: {
            lineStyle: {
              color: "#668092",
               1,
              // "type": "dashed"
            },
            show: false,
          },
        },
        series: [
          {
            data: chartdata,
            type: "bar",
            barMaxWidth: "auto",
            barWidth: 20,
            itemStyle: {
              color: {
                x: 0,
                y: 1,
                x2: 0,
                y2: 0,
                type: "linear",
                colorStops: [
                  {
                    offset: 0,
                    color: "rgba(64, 200, 169, 0.3)", // 0% 处的颜色
                  },
                  {
                    offset: 1,
                    color: "rgba(64, 200, 169, 0.8)", // 100% 处的颜色
                  },
                ],
              },
            },
          },
          {
            data: [1, 1, 1, 1, 1, 1],
            type: "pictorialBar",
            barMaxWidth: "20",
            symbol: "diamond",
            symbolOffset: [0, "50%"],
            symbolSize: [20, 0],
          },
          {
            data: chartdata,
            type: "pictorialBar",
            barMaxWidth: "20",

            symbolPosition: "end",
            symbol: "diamond",
            symbolOffset: [0, "-50%"],
            symbolSize: [20, 10],
            zlevel: 2,
          },
        ],
        tooltip: {
          show: true,
          formatter: "{b}:{c0}",
        },
      };
      window.onresize = function () {
        myChart.resize();
      };
      myChart.setOption(option);
    },