下载地址:
Elasticsearhc:  https://artifacts.elastic.co/downloads/elasticsearch/elasticsearch-5.6.4.tar.gz
Logstash:  https://artifacts.elastic.co/downloads/logstash/logstash-5.6.4.tar.gz
Kibana:   https://artifacts.elastic.co/downloads/kibana/kibana-5.6.4-x86_64.rpm
Filebeat:  https://artifacts.elastic.co/downloads/beats/filebeat/filebeat-5.6.4-x86_64.rpm
Redis:    v3.2.10
Nginx
主机
Elasticsearch/kibana/Nginx: 192.168.1.106
Redis: 192.168.1.107
Logstash 192.168.1.108
Filebeat: 192.168.1.109
一、环境准备
1.jdk安装 Elastic需要Java8环境(logstash和elastic主机安装)
2.修改文件描述符和单个用户进程数量
3.cat /etc/security/limits.conf
*    soft    nofile      65536
*    hard    nofile      65536
*    soft    nproc       65536
*    hard    nproc       65536
4.cat /etc/security/limits.d/20-nproc.conf
*          soft    nproc     65536
root       soft    nproc     unlimited
#修改进程可以拥有的虚拟内存区域数量
5.echo “vm.max_map_count=655360” >> /etc/sysctl.conf
6.sysctl -p
Elasticsearch安装
1.useradd op
2.mkdir /opt/op && mkdir /data
3.chown -R op:op /opt/op && chown -R op:op /data
4.cd /opt/op
5.su - op
wget https://artifacts.elastic.co/downloads/elasticsearch/elasticsearch-5.6.4.tar.gz
6.tar xf elasticsearch-5.6.4.tar.gz
7.mv elasticsearch-5.6.4 elasticsearch
8.cd elasticsearch
9.vim conf/elasticsearch.yml
#绑定监听IP
network.host: 192.168.1.106
#设置对外提供http服务的端口,默认是9200
http.port: 9002
#设置集群名字
cluster.name: buka_es_test
#节点名字
node.name: node1
#数据存储位置
path.data: /data
#日志存储目录
path.logs: /data/logs
#锁定内存
bootstrap.mlockall: true
10. 启动
bin/elasticsearch -d
kibana安装
1.wget https://artifacts.elastic.co/downloads/kibana/kibana-5.6.4-x86_64.rpm
2.rpm -ivh kibana-5.6.4-x86_64.rpm
3.vim /etc/kibana/kibana.yml
server.port: 5601
server.host: "192.168.1.106"
elasticsearch.url: "http://192.168.1.106:9002"
4.启动
/etc/init.d/kibana start
systemctl enable kibana
Logstash安装
1.wget https://artifacts.elastic.co/downloads/logstash/logstash-5.6.4.tar.gz 2.tar xf logstash-5.6.4.tar.gz 3.cd logstash-5.6.4
4.cat config/server.conf
input {
redis {
host => "192.168.1.108"
port => "6379"
data_type => 'list'
key => "srs"
}
}
filter {
if "srs" in [type]{
grok {
match => ["message","[%{TIMESTAMP_ISO8601:logtime}][%{WORD:level}][%{INT:id1}][%{INT:id2}] source url=%{WORD:app}/%{WORD:root}/%{DATA:stream_id}\, ip=%{IP:source_ip}\,"]
}
date {
match => [ "logtime", "yyyy-MM-dd HH:mm:ss,SSS","yyyy-MM-dd HH:mm:ss","yyyy-MM-dd HH:mm:ss:SSS" ]
target => "@timestamp"
}
}
}
output {
if "srs" in [type]{
elasticsearch {
hosts => "192.168.1.106:9002"
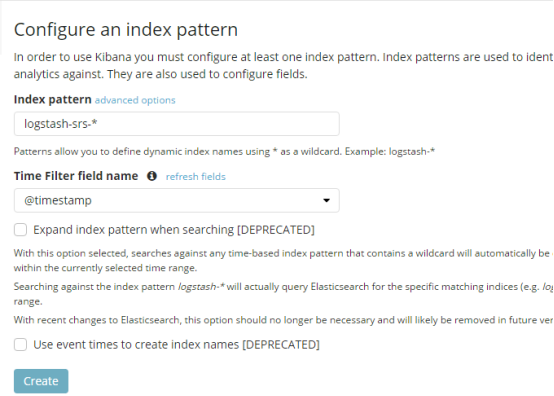
index => "logstash-srs-%{+YYYY.MM.dd}"
}
}
}
5.启动
nohup ./bin/logstash -f config/server.conf &
redis安装
1.yum -y install redis
2.vim /etc/redis.conf
  bind 127.0.0.1 192.168.1.108
3.systemctl start redis && systemctl enable redis
Filebeat安装
1.wget  https://artifacts.elastic.co/downloads/beats/filebeat/filebeat-6.0.0-x86_64.rpm
2.rpm -ivh filebeat-6.0.0-x86_64.rpm
3.vim /etc/filebeat/filebeat.yml
filebeat.prospectors:
- type: log
  paths:
    - /opt/srs/logs/srs.log
  document_type: srs
output.redis:
  hosts: ["192.168.1.108"]
  port: 6379
  key: "rtc"
4.systemctl start filebeat && systemctl enable filebeat
Nginx反向代理kibana并增加认证功能
1. yum -y install nginx httpd
2. 使用命令生成passfile 文件: htpasswd -c -d /etc/nginx/pass_file  admin
    #输入以上命令,回车输入密码,再次回车,输入确认密码
3. nginx.conf 配置文件
location / {
            auth_basic "Restricted";
            auth_basic_user_file /etc/nginx/pass_file;
            proxy_pass http://192.168.1.106:5601;
            proxy_set_header Host $host:5601;
            proxy_set_header X-Real-IP $remote_addr;
            proxy_set_header X-Forwarded-For $proxy_add_x_forwarded_for;
}
4. systemctl start nginx && systemctl enable nginx
访问kibana
http://192.168.1.106