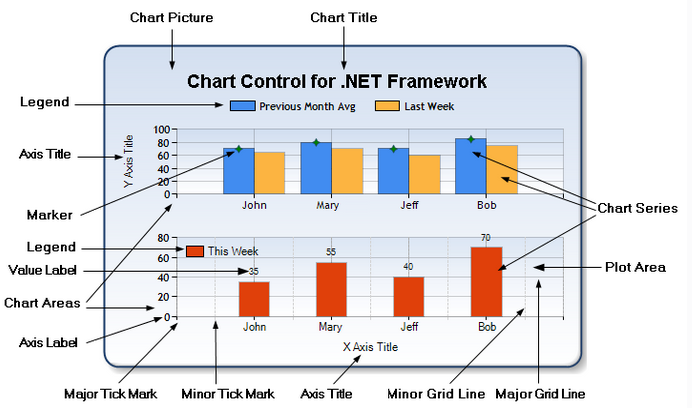
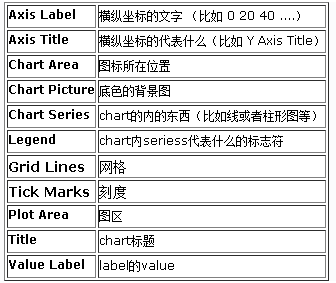
Chart图表解释说明:
第一步:使用VS创建Winform项目;
第二步:工具箱中拖入Chart控件;
第三步:所有控件拖入其他控件如下图所示:
using System;
using System.Collections.Generic;
using System.Drawing;
using System.Windows.Forms;
using System.Windows.Forms.DataVisualization.Charting;

namespace ZB.PISS.StatisticsSys
{
    public partial class Form1 : Form
    {
        public Form1()
        {
            InitializeComponent();
        }

        private void Form1_Load(object sender, EventArgs e)
        {
            List<int> x = new List<int> { 1, 2, 3, 4, 5 };

            List<int> a = new List<int> { 11, 22, 30, 40, 50 };
            List<int> b = new List<int> { 22, 14, 35, 24, 44 };
            List<int> c = new List<int> { 33, 22, 33, 44, 28 };
            var dd = chartDemo.Series;

            this.chartDemo.Series["name1"].Points.DataBindXY(x, a);
            this.chartDemo.Series["name2"].Points.DataBindXY(x, b);
            this.chartDemo.Series["name3"].Points.DataBindXY(x, c);
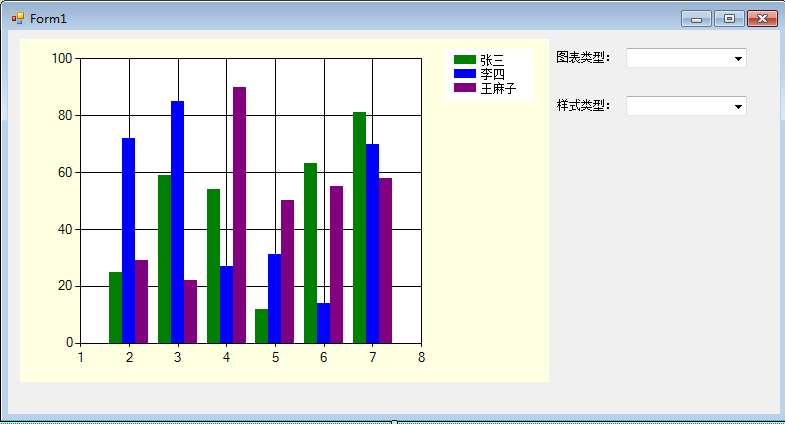
Winfrom chart DataBindXY X内容显示不全解决方法如下:
chartImage.ChartAreas["ChartArea1"].AxisX.LabelAutoFitStyle = LabelAutoFitStyles.None;
chartImage.ChartAreas["ChartArea1"].AxisX.LabelStyle.Interval = 1;
chartImage.ChartAreas["ChartArea1"].AxisX.LabelStyle.IsStaggered = false;
//Chart Title
            this.chartDemo.Titles.Add("人员信息统计").Alignment = ContentAlignment.MiddleCenter;
            Color[] arr = chartDemo.PaletteCustomColors;
            this.cmbPattern.DataSource = PatternList();
            this.cmbType.DataSource = SeriesTypeList();

            //Axis Title
            this.chartDemo.ChartAreas[0].AxisX.Title = "月份信息";
            this.chartDemo.ChartAreas[0].AxisY.Title = "数量信息";

            //Lable
            //          #VALX 显示当前图例的X轴的对应文本(或数据)
            //#VAL, #VALY, 显示当前图例的Y轴的对应文本(或数据)
            //#VALY2, #VALY3, 显示当前图例的辅助Y轴的对应文本(或数据)
            //#SER: 显示当前图例的名称
            //#LABEL 显示当前图例的标签文本
            //#INDEX 显示当前图例的索引
            //#PERCENT 显示当前图例的所占的百分比
            //#TOTAL 总数量
            //#LEGENDTEXT 图例文本
            this.chartDemo.Series[0].Label = "#VAL";
            this.chartDemo.Series[1].Label = "#VAL";
            this.chartDemo.Series[2].Label = "#VAL";

            //Marker
            this.chartDemo.Series[0].MarkerSize = 20;
            this.chartDemo.Series[1].MarkerSize = 20;
            this.chartDemo.Series[2].MarkerSize = 20;
            this.chartDemo.Series[0].MarkerStyle = MarkerStyle.Circle;
            this.chartDemo.Series[1].MarkerStyle = MarkerStyle.Square;
            this.chartDemo.Series[2].MarkerStyle = MarkerStyle.Diamond;

        }

        #region ChartType
        public List<string> SeriesTypeList()
        {
            List<string> list = new List<string>();
            foreach (string item in Enum.GetNames(typeof(SeriesChartType)))
            {
                list.Add(item);
            }
            return list;
        }

        private void cmbType_SelectedValueChanged(object sender, EventArgs e)
        {
            try
            {
                SeriesChartType type = (SeriesChartType)Enum.Parse(typeof(SeriesChartType),
              this.cmbType.Text);

                this.chartDemo.Series["name1"].ChartType = type;
                this.chartDemo.Series["name2"].ChartType = type;
                this.chartDemo.Series["name3"].ChartType = type;
            }
            catch
            {
                return;
            }
        }

        #endregion

        #region Pattern
        public List<string> PatternList()
        {
            List<string> list = new List<string>();
            foreach (string item in Enum.GetNames(typeof(ChartColorPalette)))
            {
                list.Add(item);
            }
            return list;
        }

        private void cmbPattern_SelectedValueChanged(object sender, EventArgs e)
        {
            ChartColorPalette palette = (ChartColorPalette)Enum.Parse(typeof(ChartColorPalette),
                this.cmbPattern.Text);
            this.chartDemo.Palette = palette;
        }

        #endregion

    }
}
运行效果如下:
资源源码下载地址:http://download.csdn.net/my Winfrom Chart
补充:
一:实现3D效果
 private void comboBox1_SelectedValueChanged(object sender, EventArgs e)
        {
            if (this.comboBox1.Text.Equals("3D"))
            {
                 //this.chartDemo.ChartAreas[0].Area3DStyle.Enable3D = true;
                 //开启三维模式的原因是为了避免标签重叠
                 this.chartDemo.ChartAreas["ChartArea1"].Area3DStyle.Enable3D = true;//开启三维模式;PointDepth:厚度BorderWidth:边框宽
                 this.chartDemo.ChartAreas["ChartArea1"].Area3DStyle.Rotation = 15;//起始角度
                 this.chartDemo.ChartAreas["ChartArea1"].Area3DStyle.Inclination = 30;//倾斜度(0~90)
                 this.chartDemo.ChartAreas["ChartArea1"].Area3DStyle.LightStyle = LightStyle.Realistic;//表面光泽度
                 this.chartDemo.ChartAreas["ChartArea1"].AxisX.Interval = 1; //决定x轴显示文本的间隔,1为强制每个柱状体都显示,3则间隔3个显示
                 this.chartDemo.ChartAreas["ChartArea1"].AxisX.LabelStyle.Font = new Font("宋体", 9, FontStyle.Regular);
                 this.chartDemo.ChartAreas["ChartArea1"].AxisX.MajorGrid.Enabled = false;
            }
            else
            {
                this.chartDemo.ChartAreas["ChartArea1"].Area3DStyle.Enable3D = false;
            }
        }