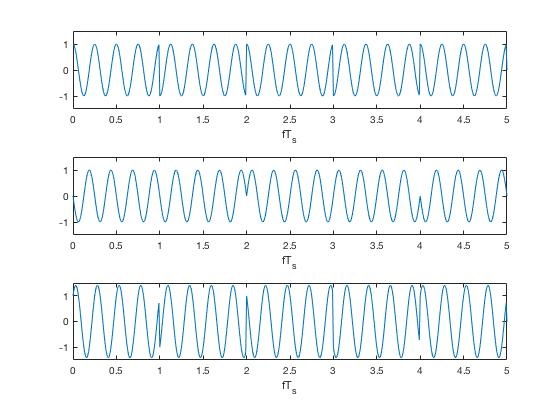
t=0:0.01:5;
fc=4;
% c=length(t);
pRec=ones(1,(length(t)-1)/5);
% 1-100
sI=zeros(1,length(t)); sQ=zeros(1,length(t));
% 500 zeros
dataI=[1 -1 1 -1 1];
indPulse=1:(length(t)-1)/5;
% 1-100
 % c1=length(dataI);
 for i=1:length(dataI)
%      5 waveforms
     sI(indPulse)=dataI(i)*pRec;
     indPulse=indPulse+length(indPulse);
 end;

 dataQ=[-1 -1 1 1 -1];
indPulse=1:(length(t)-1)/5;
% After dataI indPulse has changed so define it 1-100 again
 % c1=length(dataI);
 for i=1:length(dataQ)
%      5 waveforms
     sQ(indPulse)=dataQ(i)*pRec;
     indPulse=indPulse+length(indPulse);
 end;

 sCarI=cos(2*pi*t*fc); sCarQ=sin(2*pi*t*fc);

 figure(1);
 subplot(3,1,1); plot(t,sI.*sCarI);
 set(gca, 'Ylim',[-1.5 1.5]); xlabel('fT_s');

 subplot(3,1,2); plot(t,sQ.*sCarQ);
 set(gca, 'Ylim',[-1.5 1.5]); xlabel('fT_s');

 subplot(3,1,3); plot(t,sI.*sCarI-sQ.*sCarQ);
 set(gca, 'Ylim',[-1.5 1.5]); xlabel('fT_s');
figure1: xI(t)cos(2*pi*fc*t)
figure2: xQ(t)sin(2*pi*fc*t)
figure3: xI(t)cos(2*pi*fc*t)-xQ(t)sin(2*pi*fc*t)