pandas
# pandas  数据结构
# 导入  pandas

import pandas as pd

from pandas import DataFrame,Series

import numpy as np
Series的创建
两种创建方式:
由列表或numpy数组创建 默认索引为0到N-1的整数型索引
还可以通过设置index参数指定索引
Series(data=[1,2,3])


Series(data=[1,2,3],index=['a','b','c'])


Series(data=np.random.randint(1,100,size=(3,)))
索引 切片 去重
# Series的索引和切片

s[0:2]
# 可以使用s.head(),tail()分别查看前n个和后n个值
s.head(2)

s.tail(2)
去空 运算
s1 = Series(data=[1,2,3,4],index=['a','b','c','d'])
s2 = Series(data=[1,2,3,4],index=['a','b','e','d'])
s = s1 + s2

# 当索引没有对应的值时,可能出现缺失数据显示NaN(not a number)的情况
s

# 可以使用pd.isnull(),pd.notnull(),或s.isnull(),notnull()函数检测缺失数据

s.isnull()

# s.notnull()

s
# s[[True,True,False,False,True]]  #如果将布尔值作为Serrise的索引,则只保留True对应的元素值

# 去除 为空的
s[s.notnull()]


# Series之间的运算

# 在运算中自动对齐不同索引的数据
# 如果索引不对应,则补NaN


s1+s2
DataFrame
DataFrame是一个【表格型】的数据结构。DataFrame由按一定顺序排列的多列数据组成。设计初衷是将Series的使用场景从一维拓展到多维。DataFrame既有行索引,也有列索引。
- 行索引:index
- 列索引:columns
- 值:values
1)DataFrame的创建
最常用的方法是传递一个字典来创建。DataFrame以字典的键作为每一【列】的名称,以字典的值(一个数组)作为每一列。

此外,DataFrame会自动加上每一行的索引。

使用字典创建的DataFrame后,则columns参数将不可被使用。

同Series一样,若传入的列与字典的键不匹配,则相应的值为NaN。
DataFrame属性:values、columns、index、shape
DataFrame(data=np.random.randint(1,100,size=(3,4)))

df=DataFrame(data=np.random.randint(1,100,size=(3,4)),index=['a','b','c'],columns=['A','B','C','D'])
df


df.values

df.index

df.columns

df.shape
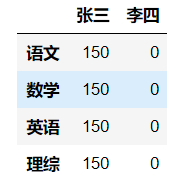
dic = {
'张三':[150,150,150,150],
'李四':[0,0,0,0]
}
df = DataFrame(data=dic,index=['语文','数学','英语','理综'])
df
索引
对列进行索引
- 通过类似字典的方式  df['q']
- 通过属性的方式     df.q
可以将DataFrame的列获取为一个Series。返回的Series拥有原DataFrame相同的索引,且name属性也已经设置好了,就是相应的列名。
对行进行索引
- 使用.loc[]加index来进行行索引
- 使用.iloc[]加整数来进行行索引
同样返回一个Series,index为原来的columns。
对元素索引的方法
- 使用列索引
- 使用行索引(iloc[3,1] or loc['C','q']) 行索引在前,列索引在后df.iloc[0] df.loc['A'] df.iloc[[0,1]] df.loc[['B','C']] df.iloc[1,1] df.loc['C','d'] df.loc[['A','B'],'c']
切片
【注意】 直接用中括号时:
- 索引表示的是列索引
- 切片表示的是行切片
df[0:2]

df.iloc[:,0:2]

df.loc['A':"C","b":"d"]
总结:
- 索引:
- 取行:df.loc['A']
- 取列:df['a']
- 取元素:df.iloc[1,2]
- 切片:
- 切行:df[0:2]
- 切列:df.iloc[:,0:2]
DataFrame的运算
DataFrame之间的运算
同Series一样:
- 在运算中自动对齐不同索引的数据
- 如果索引不对应,则补NaN
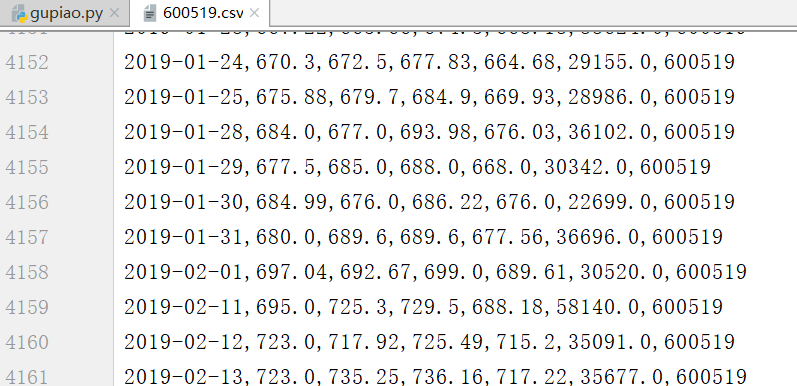
import numpy as np
import pandas as pd
from pandas import DataFrame,Series


import tushare as ts
# 使用tushare 包获取某股票的历史行情数据

df=ts.get_k_data(code='600519',start='2000-01-01')

# print(df)
# 保存
df.to_csv("./600519.csv")

# 将date这一列作为源数据的行索引,且将数据类型转换为时间类型
df=pd.read_csv('./600519.csv',index_col='date',parse_dates=['date'])

df.drop(labels='Unnamed: 0',axis=1,inplace=True)


# 保存
df.to_csv("./600519.csv")
# 显示前5行
# print(df.head(5))

#输出该股票所有收盘比开盘上涨3%以上的日期。

#(收盘-开盘)/开盘 >= 0.03
# (df['close']-df['open'])/df['open']>=0.03

# 将上述表达式返回的布尔值作为df 的行索引,取出所有符合要求的数据

# 符合条件的行数据
# print(df.loc[(df['close']-df['open'])/df['open']>=0.03])
# 符合条件的日期

# print(df.loc[(df['close']-df['open'])/df['open']>=0.03].index)

#输出该股票所有开盘比前日收盘跌幅超过2%的日期。
#(开盘 - 前日收盘) / 前日收盘  < -0.02

# df['open']-df['close'].shift(1)/df['close'].shift(1)


# 符合条件的数据
# print(df.loc[(df['open']-df['close'].shift(1))/df['close'].shift(1)<-0.02])
# print(df.loc[(df['open']-df['close'].shift(1))/df['close'].shift(1)<-0.02].index)


#假如我从2010年1月1日开始,每月第一个交易日买入1手股票,每年最后一个交易日卖出所有股票,到今天为止,我的收益如何?

# print(df)
df=df.loc['2010':'2019']
# print(df)
# print(df.head(5))

# 数据重新取样(取样结果 日期有错误,自身的问题)
df_monthly=df.resample('M').first()
# 最后一个日期的结果去掉 因为还未到年底
df_yearly=df.resample('A').last()[:-1]
# print(df_monthly)
# print(df_yearly)

# 一手 是100股
cost_money=df_monthly['open'].sum()*100

# 还需要加上今年投入的股票
# df_yearly['open'].sum()*12*100

# 现在8月份,所以乘8
recv_money=df_yearly['open'].sum()*12*100+df['open'][-1]*800
final_money=recv_money-cost_money
print(final_money)

# 结果391697.69999999925    8.12