简述
我试图利用空闲时间玩玩爬虫,正巧也想看看现在市场上的岗位行情。所以就试着用py去执行。
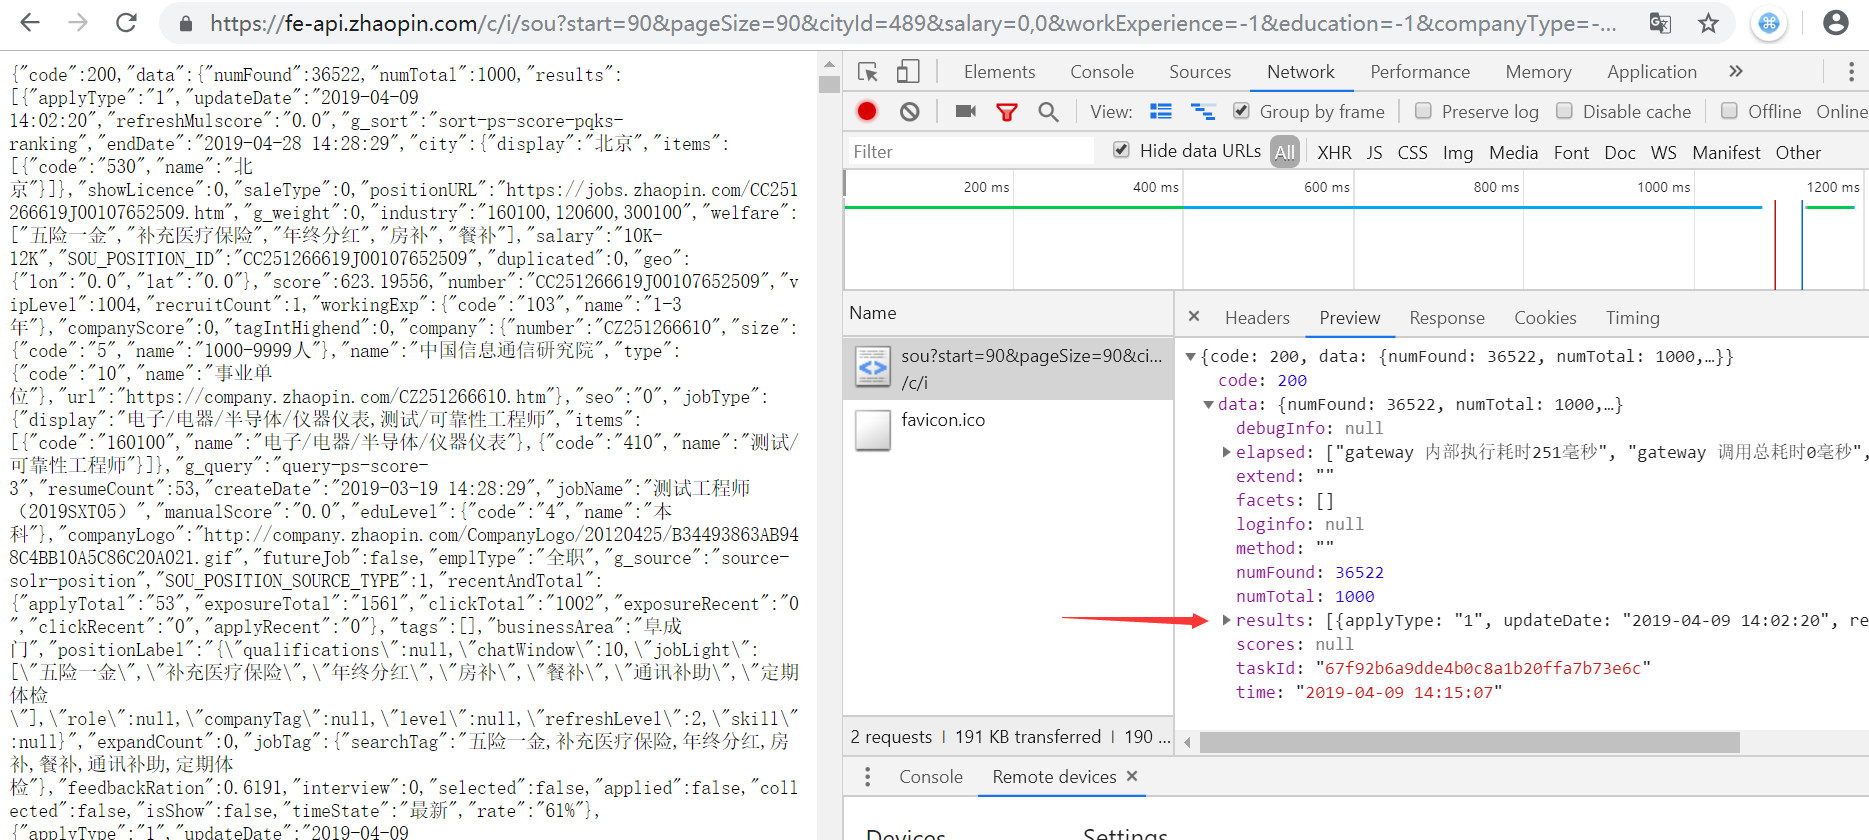
然后尴尬的事情出现了,智联上有另外一个查询入口,根本不需要走html去识别页面上信息,直接搜寻这个api返回json数据。。。
所以,爬虫是不可能的了~~~
着手获取json数据
1)获取数据api:https://fe-api.zhaopin.com
2)返回结果格式:json

3)使用requests模块对改api进行请求:[api接口参数可以使用F12进行观察传参]

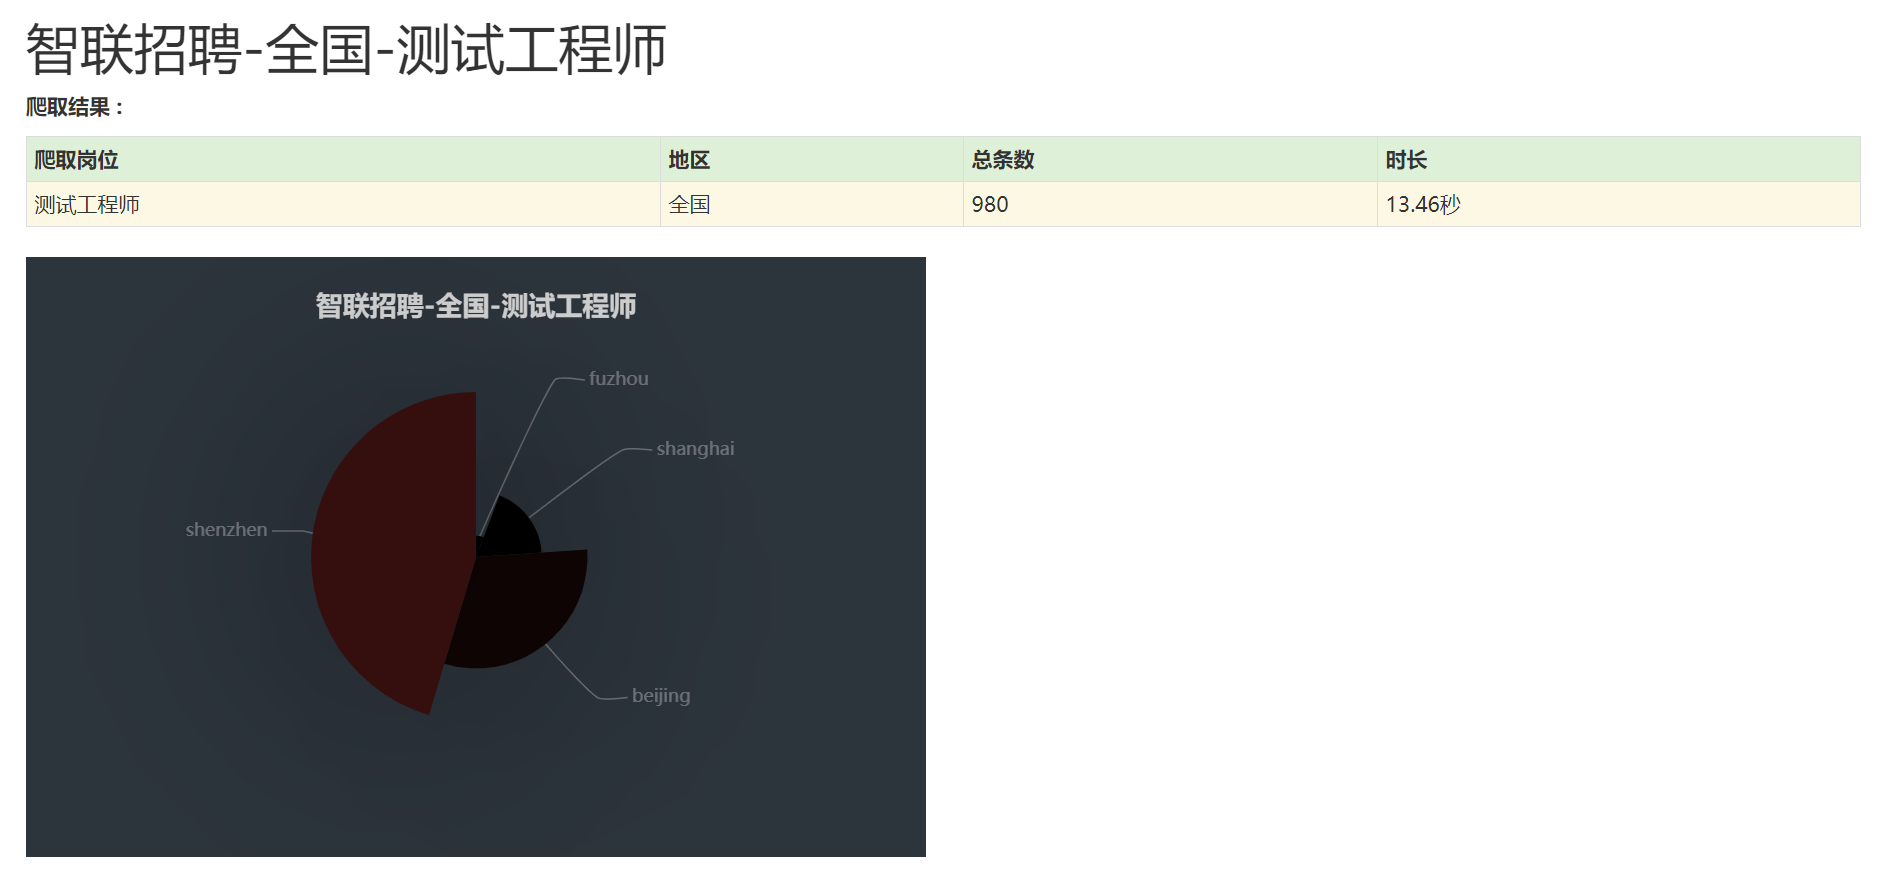
4)为了使结果可以更直观些,引入js、html模板,总文件如下:

5)源码如下
qaByZhiLian.py

# -*- coding:UTF-8 -*-
#!/usr/bin/env python
import os
import sys
import time
import re,json
import requests
from datetime import datetime
from TemplateHtml import TemplateHtml,TemplateCount
reload(sys)
sys.setdefaultencoding('utf8')

class getall(object):
    #定义全局变量
    resultsArr=[]
    elapsedArr=[]

    # 给请求指定一个请求头来模拟chrome浏览器
    headers = {'User-Agent': 'Mozilla/5.0 (Windows NT 10.0; Win64; x64) AppleWebKit/537.36 (KHTML, like Gecko) Chrome/54.0.2840.99 Safari/537.36'}
    # 爬取地址,这里假定数据页面不大于8,没做二次判断
    page_max = 20
    start_time = time.time()
    for i in range(1,int(page_max)+1):
        if i == 1:
            house="https://fe-api.zhaopin.com/c/i/sou?start=90&pageSize=90&cityId=489&salary=0,0&workExperience=-1&education=-1&companyType=-1&employmentType=-1&jobWelfareTag=-1&kw=%E6%B5%8B%E8%AF%95%E5%B7%A5%E7%A8%8B%E5%B8%88&kt=3"
        else:
            start=(i-1)*90
            house="https://fe-api.zhaopin.com/c/i/sou?start="+str(start)+("&pageSize=90&cityId=489&salary=0,0&workExperience=-1&education=-1&companyType=-1&employmentType=-1&jobWelfareTag=-1&kw=%E6%B5%8B%E8%AF%95%E5%B7%A5%E7%A8%8B%E5%B8%88&kt=3")
        res = requests.get(house, headers=headers)
        res.encoding='utf-8'
        #soup = BeautifulSoup(res.text, 'html.parser')
        resJson=json.loads(res.text)
        results=(resJson["data"]["results"])
        elapsed=resJson["data"]["elapsed"]
        if len(results)>1:
            resultsArr.append(results)
            elapsedArr.append(elapsed)
    end_time = time.time()
    difftime=str("%.2f" %(end_time-start_time))
    #输出格式化后数据
    #html = TemplateHtml()
    totalData=TemplateCount()
    table_tr0=""
    jobCount=1
    cityDic={"beijing":0,"fuzhou":0,"shanghai":0,"shenzhen":0}

    dataCity=[]
    #fp=open("data.txt","w+")
    for i in range(1,len(resultsArr)):
        print("第几页:" + str(i))
        results=resultsArr[i]
        for j in range(1,len(results)):
            result=results[j]
            jobName=result["jobName"]
            display=result["city"]["display"]
            companyUrl=result["company"]["url"]
            welfare=result["welfare"]
            salary=result["salary"]
            companyName=result["company"]["name"]
            jobCount=jobCount+1
            if "北京" in display:
                cityDic["beijing"]=cityDic["beijing"]+1
            if "福州" in display:
                cityDic["fuzhou"]=cityDic["fuzhou"]+1
            if "上海" in display:
                cityDic["shanghai"]=cityDic["shanghai"]+1
            if "深圳" in display:
                cityDic["shenzhen"]=cityDic["shenzhen"]+1
            #print(welfare)
            #print("岗位名称:"+jobName+",公司名称:"+companyName+",位置:"+display+",薪资:"+salary+",公司地址:"+companyUrl+"
")

            '''
            strResult="岗位名称:"+jobName+",公司名称:"+companyName+",位
置:"+display+",薪资:"+salary+",公司地址:"+companyUrl+"
"
            table_td = html.TABLE_TMPL % dict(
                                   jobName=jobName,
                                   companyName=companyName,
                                   display=display,
                                   salary=salary,
                   companyUrl=companyUrl,
                                  )
            table_tr0 += table_td
            '''

    '''
    output = html.HTML_TMPL % dict(

                           table_tr = table_tr0,
                           )
    '''
    print(cityDic)
    for key in cityDic:
        tmpdic={}
        tmpdic['name']=key
        tmpdic['value']=cityDic[key]
        dataCity.append(tmpdic)
    print(str(dataCity))
    output_total=totalData.HTML_TMPL % dict(
                           jobName="测试工程师",
                           area="全国",
                           count=jobCount,
                           totaltime="%s%s" %(difftime,"秒"),
                           readata=json.dumps(dataCity),
                           )
            #fp.writelines(strResult)
    #fp.close()
    #with open("Decision_KKD.html",'wb') as f:
    #            f.write(output.encode('utf-8'))
    with open("total.html",'wb') as f:
                f.write(output_total.encode('utf-8'))

if __name__ == "__main__":
    cityIdArr={"489"}
    test=getall()
TemplateHtml.py

# -*- coding:UTF-8 -*-
#!/usr/bin/env python

class TemplateHtml(object):
    """html报告"""
    HTML_TMPL = """
    <!DOCTYPE html>
    <html lang="zh-cn">
    <head>
      <meta charset="UTF-8">
      <title>爬虫报告</title>
      <link href="http://libs.baidu.com/bootstrap/3.0.3/css/bootstrap.min.css" rel="stylesheet">
      <h1 style="font-family: Microsoft YaHei">智联招聘-全国-测试工程师</h1>
      <p class='attribute'><strong>爬取结果 : </strong></p>
      <style type="text/css" media="screen">
        body{ font-family: Microsoft YaHei,Tahoma,arial,helvetica,sans-serif;padding: 20px;}
      </style>
    </head>
    <body>
      <table id='result_table' class="table table-condensed table-bordered table-hover">
      <colgroup>
       <col align='left' />
       <col align='right' />
       <col align='right' />
       <col align='right' />
      </colgroup>
      <tr id='header_row' class="text-center success" style="font-weight: bold;font-size: 14px;">
         <th>岗位名称</th>
         <th>公司名称</th>
         <th>位置</th>
         <th>薪资</th>
         <th>公司地址</th>
       </tr>
       %(table_tr)s
    </table>
    """
    TABLE_TMPL = """
        <tr class='failClass warning'>
            <td>%(jobName)s</td>
            <td>%(companyName)s</td>
            <td>%(display)s</td>
            <td>%(salary)s</td>
        <td><a href=%(companyUrl)s>%(companyUrl)s</a></td>
        </tr>"""

class TemplateCount(object):
    """html报告"""
    HTML_TMPL = """
    <!DOCTYPE html>
    <html lang="zh-cn">
    <head>
      <meta charset="UTF-8">
      <title>爬虫报告</title>
      <link href="http://libs.baidu.com/bootstrap/3.0.3/css/bootstrap.min.css" rel="stylesheet">

      <script src="http://ajax.aspnetcdn.com/ajax/jQuery/jquery-1.8.0.js"></script>
      <script type="text/javascript" src="http://echarts.baidu.com/gallery/vendors/echarts/echarts.min.js"></script>
      <script src="fun.js"></script>
      <h1 style="font-family: Microsoft YaHei">智联招聘-全国-测试工程师</h1>
      <p class='attribute'><strong>爬取结果 : </strong></p>
      <style type="text/css" media="screen">
        body{ font-family: Microsoft YaHei,Tahoma,arial,helvetica,sans-serif;padding: 20px;}
      </style>
    </head>
    <body>
      <table id='result_table' class="table table-condensed table-bordered table-hover">
      <colgroup>
       <col align='left' />
       <col align='right' />
       <col align='right' />
       <col align='right' />
      </colgroup>
      <tr id='header_row' class="text-center success" style="font-weight: bold;font-size: 14px;">
         <th>爬取岗位</th>
         <th>地区</th>
         <th>总条数</th>
         <th>时长</th>
       </tr>
       <tr class='failClass warning'>
            <td>%(jobName)s</td>
            <td>%(area)s</td>
            <td>%(count)s</td>
            <td>%(totaltime)s</td>
        </tr>
    </table>
    <!-- 为ECharts准备一个具备大小(宽高)的Dom -->
    <div id="main" style=" 600px;height:400px;"></div>
    <script>
    $(function(){
        var myChart = echarts.init(document.getElementById('main'));
        var data=%(readata)s;
        option=setPie(data);
        if (option && typeof option === "object") {
            myChart.setOption(option, true);
        }
    });
    </script>
    """
fun.js

function setPie(readata){
    //var data=JSON.parse(readata);
    var data=readata;
    console.log(data);
    option = {
        backgroundColor: '#2c343c',

        title: {
            text: '智联招聘-全国-测试工程师',
            left: 'center',
            top: 20,
            textStyle: {
                color: '#ccc'
            }
        },

        tooltip : {
            trigger: 'item',
            formatter: "{a} <br/>{b} : {c} ({d}%)"
        },

        visualMap: {
            show: false,
            min: 80,
            max: 600,
            inRange: {
                colorLightness: [0, 1]
            }
        },
        series : [
            {
                name:'岗位数',
                type:'pie',
                radius : '55%',
                center: ['50%', '50%'],
                data:data.sort(function (a, b) { return a.value - b.value; }),
                roseType: 'radius',
                label: {
                    normal: {
                        textStyle: {
                            color: 'rgba(255, 255, 255, 0.3)'
                        }
                    }
                },
                labelLine: {
                    normal: {
                        lineStyle: {
                            color: 'rgba(255, 255, 255, 0.3)'
                        },
                        smooth: 0.2,
                        length: 10,
                        length2: 20
                    }
                },
                itemStyle: {
                    normal: {
                        color: '#c23531',
                        shadowBlur: 200,
                        shadowColor: 'rgba(0, 0, 0, 0.5)'
                    }
                },

                animationType: 'scale',
                animationEasing: 'elasticOut',
                animationDelay: function (idx) {
                    return Math.random() * 200;
                }
            }
        ]
    };
    return option;
};
6) 引入的外部js使用cdn连接,包括bootstrap.min.css、jquery-1.8.0.js、echarts.min.js
结果:
1)结果数据只解析了部分~

