一、K-均值聚类(K-means)
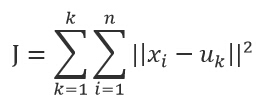
k-means算法是一种简单的迭代型聚类算法,采用距离作为相似性指标,从而发现给定数据集中的K个类,且每个类的中心是根据类中所有值的均值得到,每个类用聚类中心来描述。对于给定的一个包含n个d维数据点的数据集X以及要分得的类别K,选取欧式距离作为相似度指标,聚类目标是使得各类的聚类平方和最小,即最小化:
结合最小二乘法和拉格朗日原理,聚类中心为对应类别中各数据点的平均值,同时为了使得算法收敛,在迭代过程中,应使最终的聚类中心尽可能的不变。
二、算法步骤
K-means是一个反复迭代的过程,算法分为四个步骤:
1) 选取数据空间中的K个对象作为初始中心,每个对象代表一个聚类中心;
2) 对于样本中的数据对象,根据它们与这些聚类中心的欧氏距离,按距离最近的准则将它们分到距离它们最近的聚类中心(最相似)所对应的类;
3) 更新聚类中心:将每个类别中所有对象所对应的均值作为该类别的聚类中心,计算目标函数的值;
4) 判断聚类中心和目标函数的值是否发生改变,若不变,则输出结果,若改变,则返回2)。
三、实例
# -*- coding: UTF-8 -*-
import numpy
import random
import matplotlib.pyplot as plt
def calculateDistance(vecA, vecB):

    return numpy.sqrt(numpy.sum(numpy.square(vecA - vecB)))
def findCentroids(data_get, k):

    return random.sample(data_get, k)


def minDistance(data_get, centroidList):

    clusterDict = dict()
    for element in data_get:
        vecA = numpy.array(element)
        flag = 0
        minDis = float("inf")

        for i in range(len(centroidList)):
            vecB = numpy.array(centroidList[i])
            distance = calculateDistance(vecA, vecB)
            if distance < minDis:
                minDis = distance
                flag = i

        if flag not in clusterDict.keys():
            clusterDict[flag] = list()
        clusterDict[flag].append(element)

    return clusterDict


def calculate_Var(clusterDict, centroidList):

    sum = 0.0
    for key in clusterDict.keys():
        vecA = numpy.array(centroidList[key])
        distance = 0.0
        for item in clusterDict[key]:
            vecB = numpy.array(item)
            distance += calculateDistance(vecA, vecB)
        sum += distance

    return sum
def getCentroids(clusterDict):

    centroidList = list()
    for key in clusterDict.keys():
        centroid = numpy.mean(numpy.array(clusterDict[key]), axis=0)
        centroidList.append(centroid)

    return numpy.array(centroidList).tolist()
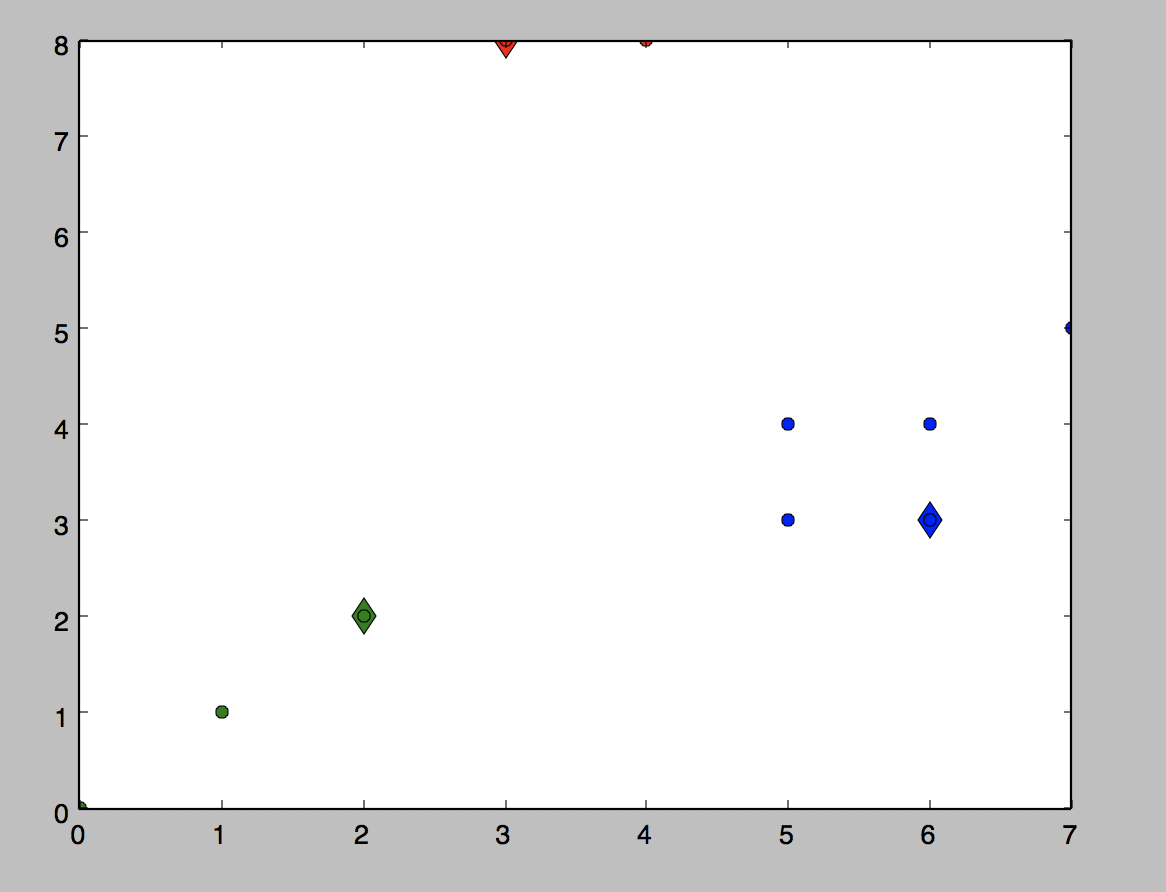
def showCluster(centroidList, clusterDict):

    colorMark = ['or', 'ob', 'og', 'ok', 'oy', 'ow']
    centroidMark = ['dr', 'db', 'dg', 'dk', 'dy', 'dw']
    for key in clusterDict.keys():
        plt.plot(centroidList[key][0], centroidList[key][1], centroidMark[key], markersize=12)
        for item in clusterDict[key]:
            plt.plot(item[0], item[1], colorMark[key])

    plt.show()


data = [[0.0, 0.0], [3.0, 8.0], [2.0, 2.0], [1.0, 1.0], [5.0, 3.0],
        [4.0, 8.0], [6.0, 3.0], [5.0, 4.0], [6.0, 4.0], [7.0, 5.0]]

if __name__ == '__main__':

    centroidList = findCentroids(data, 3)
    clusterDict = minDistance(data, centroidList)
    newVar = calculate_Var(clusterDict, centroidList)
    oldVar = -0.0001

    print('***** 第1次迭代 *****')
    for key in clusterDict.keys():
        print('聚类中心: ', centroidList[key])
        print('对应聚类: ',clusterDict[key])
    print('平均均方误差: ', newVar)
    showCluster(centroidList, clusterDict)

    k = 2
    while abs(newVar - oldVar) >= 0.0001:
        centroidList = getCentroids(clusterDict)
        clusterDict = minDistance(data, centroidList)
        oldVar = newVar
        newVar = calculate_Var(clusterDict, centroidList)

        print('***** 第%d次迭代 *****' % k)

        for key in clusterDict.keys():
            print('聚类中心: ', centroidList[key])
            print('对应聚类: ', clusterDict[key])
        print('平均均方误差: ', newVar)
        showCluster(centroidList, clusterDict)

        k += 1
结果: