我们预测阶段时:
- 生成多个锚框
- 每个锚框预测类别和偏移量
但是,当同一个目标上可能输出较多的相似的预测边界框。我们可以移除相似的预测边界框。——NMS(非极大值抑制)。
对于一个预测边界框B,模型会计算各个类别的预测概率,选择最大的那个p,也叫p是这个框的置信度。
在同一张图像上,我们将预测类别非背景的预测边界框按照置信度排序,得到列表L。从L中选择最高的B1作为基准,将所有与B1的交并比大于某个阀值的非基准预测边界框从L中移除。(这里阀值是超参数)。
这样,L保留了置信度最高的预测边界框,并移除了与其他相似的其他预测边界框。依次进行下去。直到L中所有预测边界都作为了基准。最终,输出L中的所有预测边界框。
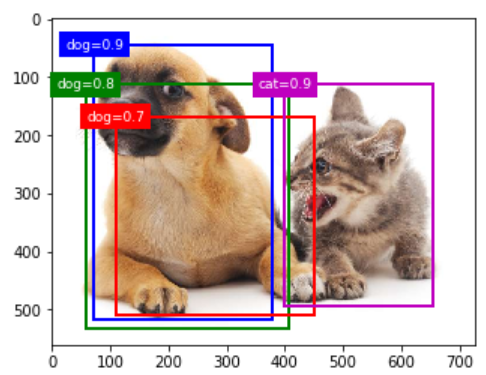
%matplotlib inline
import gluonbook as gb
from mxnet import nd,gluon,contrib,image
import numpy as np
np.set_printoptions(2)

img = image.imread('./catdog.jpg').asnumpy()
h, w = img.shape[0:2]

bbox_scale = nd.array((w,h,w,h))

anchors = nd.array([[0.1, 0.08, 0.52, 0.92], [0.08, 0.2, 0.56, 0.95],
                    [0.15, 0.3, 0.62, 0.91], [0.55, 0.2, 0.9, 0.88]])

offset_preds = nd.array([0]*anchors.size)
offset_preds,anchors.size

cls_probs = nd.array([[0]*4,             # 背景的预测概率
                     [0.9,0.8,0.7,0.1],  # 狗的预测概率
                     [0.1,0.2,0.3,0.9]]) # 猫的预测概率

def show_bboxes(axes, bboxes, labels=None, colors=None):
    def _make_list(obj, default_values=None):
        if obj is None:
            obj = default_values
        elif not isinstance(obj, (list, tuple)):
            obj = [obj]
        return obj

    labels = _make_list(labels)
    colors = _make_list(colors, ['b', 'g', 'r', 'm', 'c'])
    for i, bbox in enumerate(bboxes):
        color = colors[i % len(colors)]
        rect = gb.bbox_to_rect(bbox.asnumpy(), color)
        axes.add_patch(rect)
        if labels and len(labels) > i:
            text_color = 'k' if color == 'w' else 'w'
            axes.text(rect.xy[0], rect.xy[1], labels[i],
                      va='center', ha='center', fontsize=9, color=text_color,
                      bbox=dict(facecolor=color, lw=0))

fig = gb.plt.imshow(img)
show_bboxes(fig.axes, anchors * bbox_scale,
            ['dog=0.9', 'dog=0.8', 'dog=0.7', 'cat=0.9'])

output = contrib.ndarray.MultiBoxDetection(
    cls_probs.expand_dims(axis=0), offset_preds.expand_dims(axis=0),
    anchors.expand_dims(axis=0), nms_threshold=0.5)
output

fig = gb.plt.imshow(img)
for i in output[0].asnumpy():
    if i[0] == -1:
        continue
    label = ('dog=','cat=')[int(i[0])] + str(i[1])
    show_bboxes(fig.axes,[nd.array(i[2:])*bbox_scale],label)