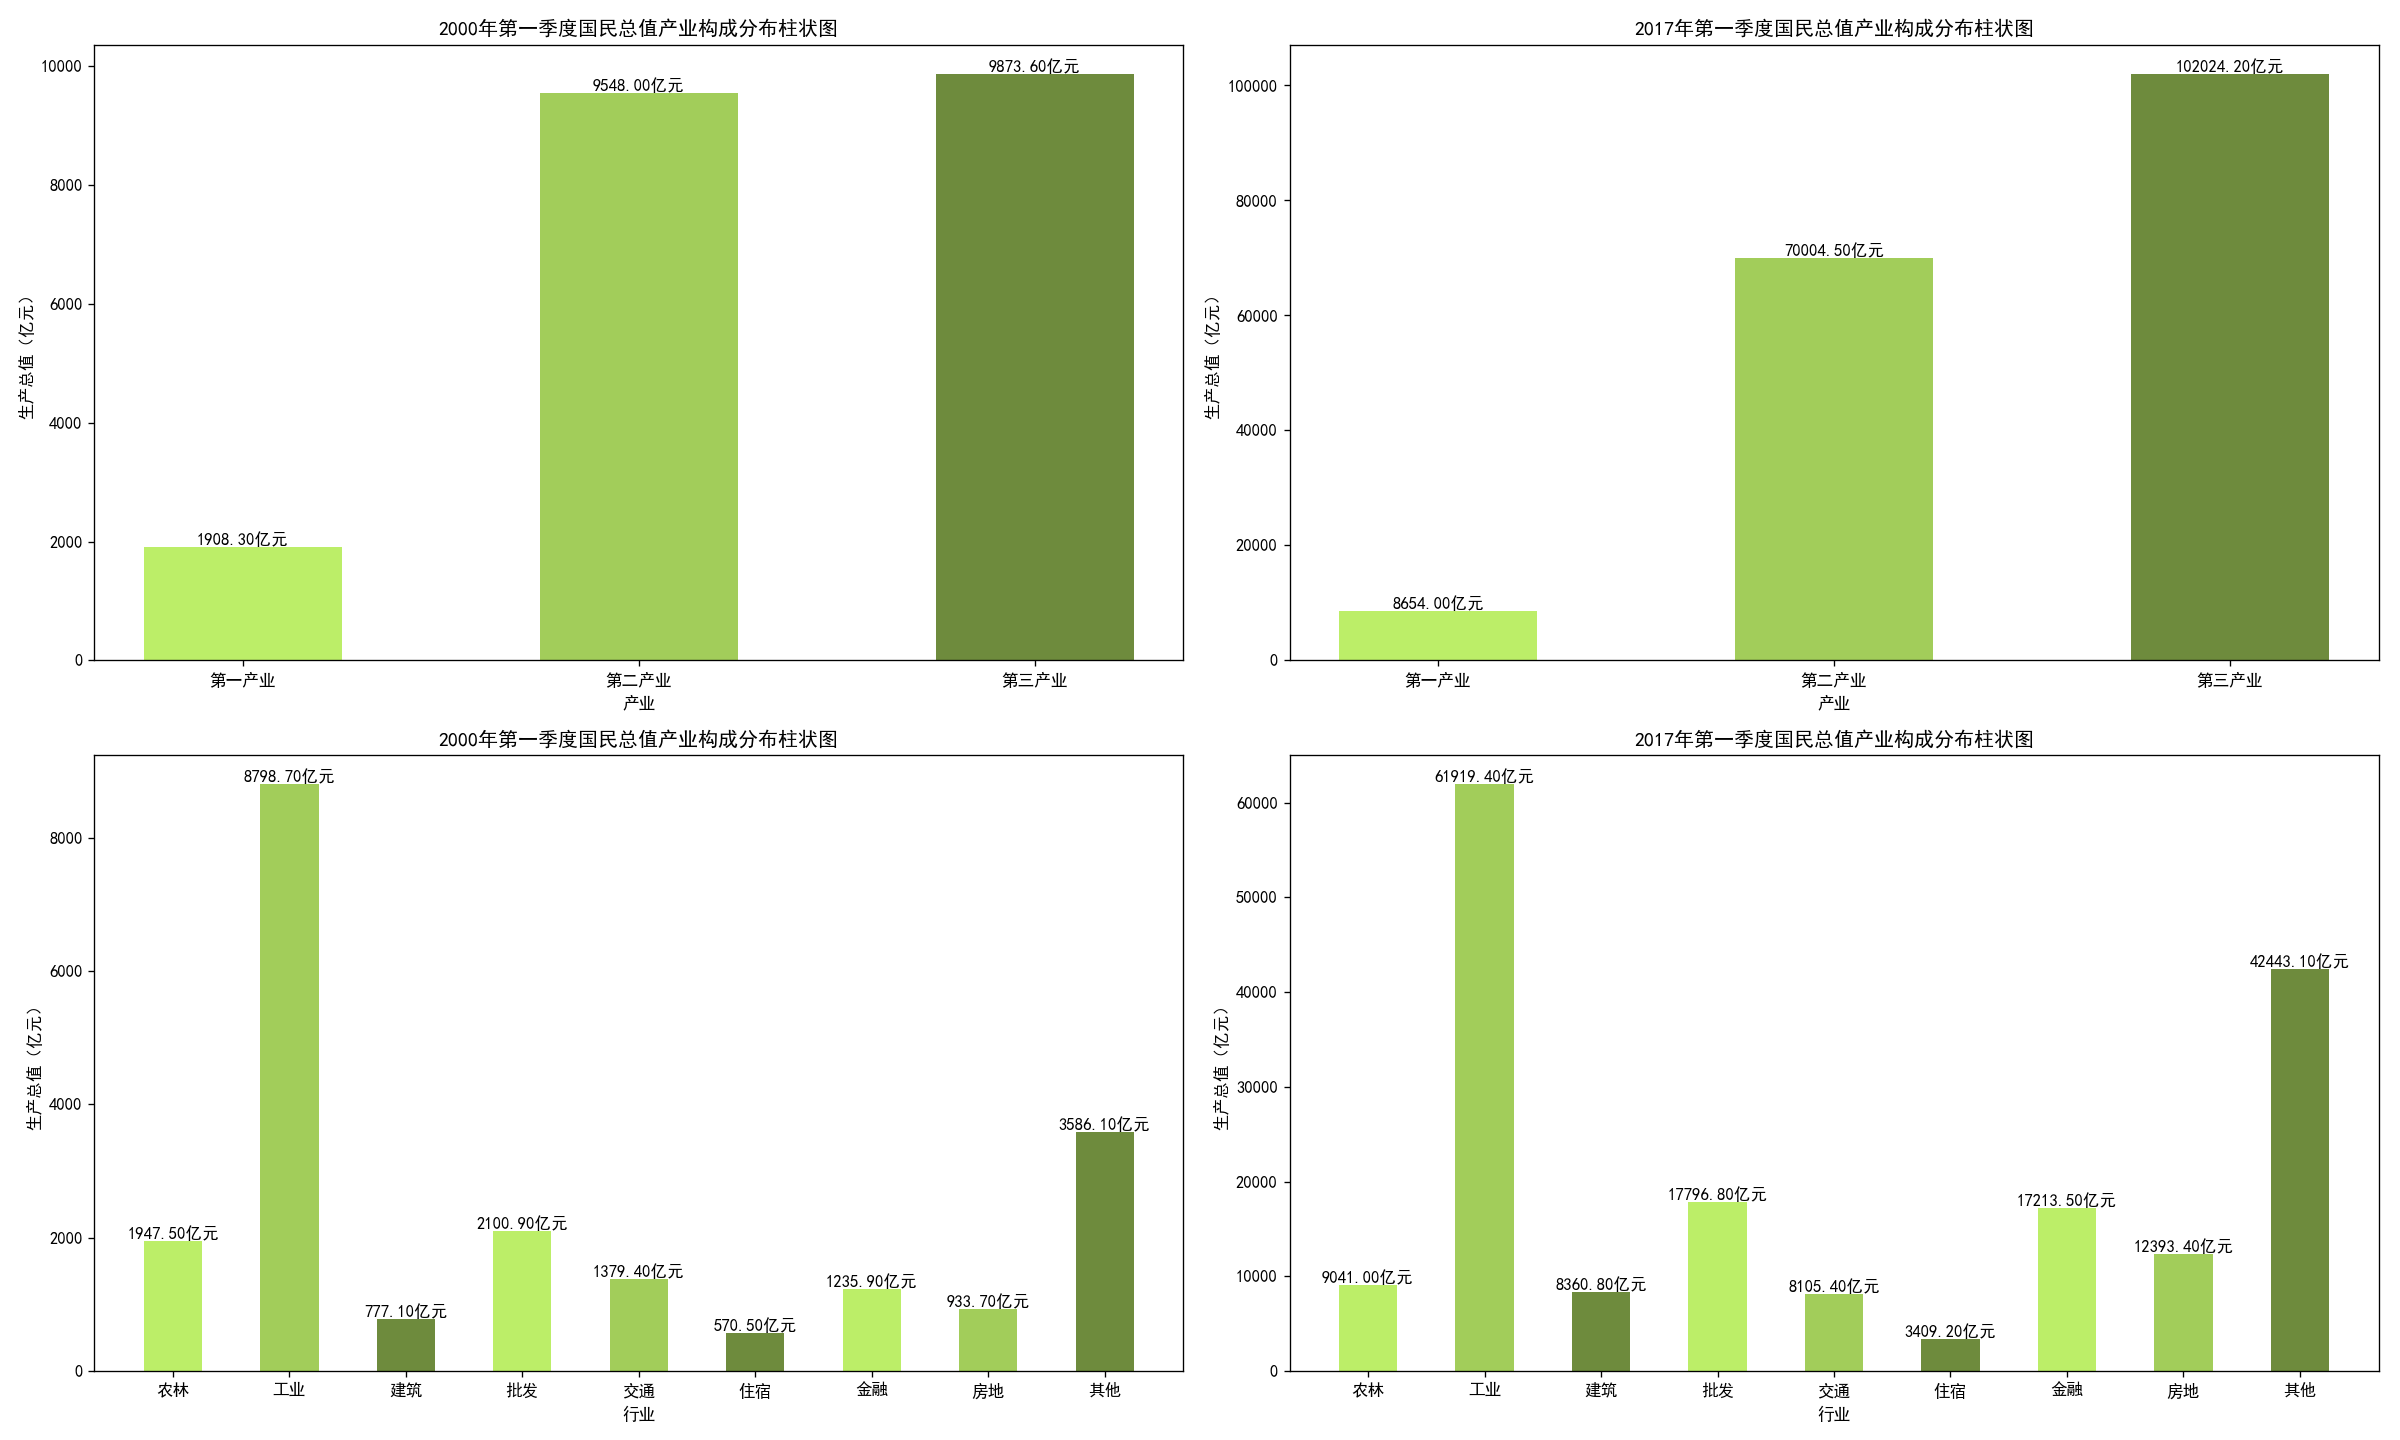
 1 import matplotlib.pyplot as plt
 2 import numpy as np
 3
 4 def draw_data(n, a, b, c, d, values, fig, plt, t, xl, ticks):
 5     fig.add_subplot(2, 2, n)
 6     x = np.arange(1, c, 1)
 7     y = values[d, a:b+1]
 8     print("---y---:
",y)
 9     plt.bar(x, y, width=0.5, color=["#BCEE68", "#A2CD5A", "#6E8B3D"])
10     plt.title(t)
11     plt.xlabel(xl)
12     plt.ylabel("生产总值(亿元)")
13     plt.xticks(x, ticks)
14     for i,j in zip(x, y):
15         plt.text(i, j, "%.2f亿元"%j, horizontalalignment='center', verticalalignment='bottom')
16     return plt
17
18 def show_data():
19     fig = plt.figure(figsize=(20, 12), dpi=120)
20     plt.rcParams['font.sans-serif'] = 'SimHei'
21     plt.rcParams['axes.unicode_minus'] = False
22     # plt.subplots_adjust(hspace=0.3)
23     return fig, plt
24
25 def save_data():
26     plt.savefig("./2000-2017年各个产业、行业的柱状图.png")
27     plt.show()
28     return None
29
30
31 def build_data():
32     res = np.load("./国民经济核算季度数据.npz", allow_pickle=True)
33     columns = res["columns"]
34     values = res["values"]
35     # print(columns)
36     # print(values)
37     return columns, values
38
39 def main():
40     columns, values = build_data()
41     fig, plt = show_data()
42     title1 = "2000年第一季度国民总值产业构成分布柱状图"
43     title2 = "2017年第一季度国民总值产业构成分布柱状图"
44     xlabel1 = "产业"
45     xlabel2 = "行业"
46     ticks1 = [tmp[:4] for tmp in columns[3:6]]
47     ticks2 = [tmp[:2] for tmp in columns[6:]]
48     draw_data(1, 3, 5, 4, 0, values, fig, plt, title1, xlabel1, ticks1)
49     draw_data(2, 3, 5, 4, 68, values, fig, plt, title2, xlabel1, ticks1)
50     draw_data(3, 6, 14, 10, 0, values, fig, plt, title1, xlabel2, ticks2)
51     draw_data(4, 6, 14, 10, 68, values, fig, plt, title2, xlabel2, ticks2)
52     save_data()
53
54
55 if __name__ == '__main__':
56     main()