安装sklearn需要的库请全部在万能仓库下载:
http://www.lfd.uci.edu/~gohlke/pythonlibs/#scipy
http://www.lfd.uci.edu/~gohlke/pythonlibs/#numpy
http://www.lfd.uci.edu/~gohlke/pythonlibs/#matplotlib
http://www.lfd.uci.edu/~gohlke/pythonlibs/#scikit-learn
安装方法请看:
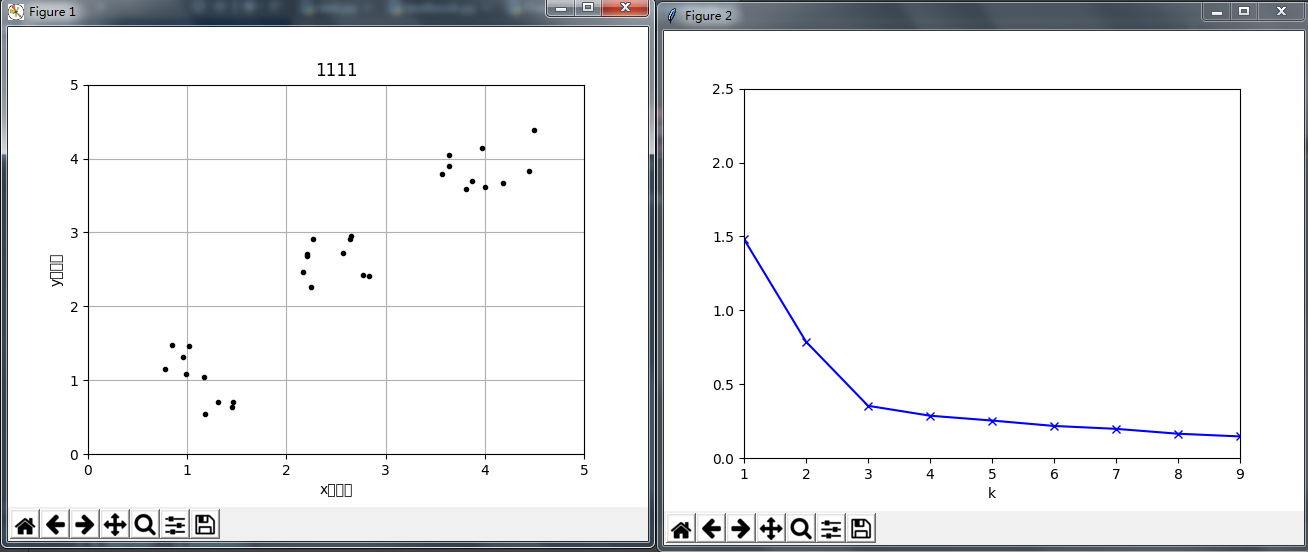
安装成功后测试集代码:
#!/usr/bin/python3.4
# -*- coding: utf-8 -*-


import numpy as np
import matplotlib.pyplot as plt

# 随机生成一个实数,范围在(0.5,1.5)之间,2行10列
cluster1 = np.random.uniform(0.5, 1.5, (2, 10))
cluster2 = np.random.uniform(3.5, 4.5, (2, 10))
cluster3 = np.random.uniform(2, 3, (2, 10))
# hstack拼接操作
X = np.hstack((cluster1, cluster2,cluster3)).T
print(X)
# 生成第一张图
plt.figure(1)
# 横轴为0-5,纵轴为0-5
plt.axis([0, 5, 0, 5])

# 是否有网格
plt.grid(True)
# x轴文字
plt.xlabel('x轴文字')
# y轴文字
plt.ylabel('y轴文字')
# K为黑色,k.为黑色的点
# [:,0]代表全部行第0列
plt.plot(X[:, 0], X[:, 1], 'k.')
# 给个标题
plt.title("1111")
# plt.show()

from sklearn.cluster import KMeans
# 用scipy求解距离
from scipy.spatial.distance import cdist

K = range(1, 10)
meandistortions = []
for k in K:
    kmeans = KMeans(n_clusters=k)
    kmeans.fit(X)
    meandistortions.append(sum(np.min(
        cdist(X, kmeans.cluster_centers_,
              'euclidean'), axis=1)) / X.shape[0])

# 生成第二张图
plt.figure(2)
# 横轴为1-9,纵轴为0-2.5
plt.axis([1, 9, 0, 2.5])

plt.plot(K, meandistortions, 'bx-')
plt.xlabel('k')
plt.show()
plt.close()
效果如下:
画图的库 matplotlib 使用方法请参考:
http://www.cnblogs.com/zhizhan/p/5615947.html