前言:
在用生成对抗网络生成二维数据点的时候遇到代码里的一个问题,就是numpy中的一维线性插值函数interp到底是怎么用的,在这个上面费了点功夫,因此现将其用法给出。
在生成对抗网络的二维样本生成的例子中,涉及了一维线性插值,代码里使用的是:
numpy.interp(x, xp, fp, left=None, right=None, period=None)
上网查了百度和谷歌发现都没有具体的中文的解释,只有官方的英文解释:
(One-dimensional) (linear) (interpolation.) (Returns) (the) (one-dimensional) (piecewise) (linear) (interpolant) (to) (a) (function) (with) (given) (values) (at) (discrete) (data-points.)
官方给出的例子如下:
 >>> xp = [1, 2, 3]
>>> fp = [3, 2, 0]
>>> np.interp(2.5, xp, fp)
1.0
>>> np.interp([0, 1, 1.5, 2.72, 3.14], xp, fp)
array([ 3. ,  3. ,  2.5 ,  0.56,  0. ])
>>> UNDEF = -99.0
>>> np.interp(3.14, xp, fp, right=UNDEF)
-99.0

Plot an interpolant to the sine function:

>>> x = np.linspace(0, 2*np.pi, 10)
>>> y = np.sin(x)
>>> xvals = np.linspace(0, 2*np.pi, 50)
>>> yinterp = np.interp(xvals, x, y)
>>> import matplotlib.pyplot as plt
>>> plt.plot(x, y, 'o')
[<matplotlib.lines.Line2D object at 0x...>]
>>> plt.plot(xvals, yinterp, '-x')
[<matplotlib.lines.Line2D object at 0x...>]
>>> plt.show()
其中对于第一例子,只要画出图像就很好理解了:
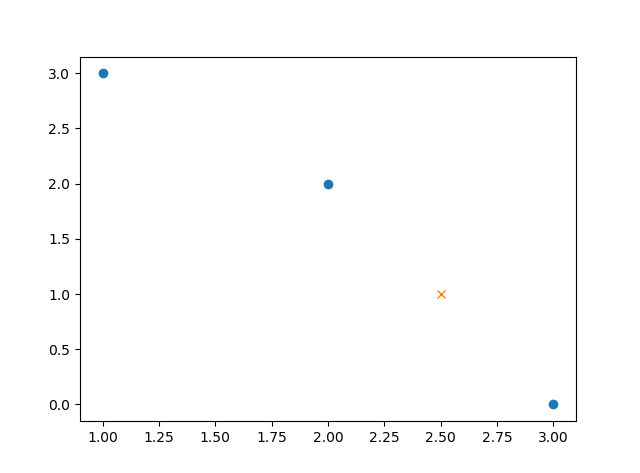
也就是说只要参数中的(2.5)是我们要插入的值,我们要做的是连接((2,2))和((3,0))这两个点,然后在(x=2.5)这里做垂线,那么相交的那个点(也就是((2.5,1.0))这个点)就是我们要插入的点了。