搭建kubernetes集群,有一个默认的dashboard,但是这个dashboard比较简陋,不能将自定义展示。所以打算使用Grafana+Heapster+Influxdb构建一个一体化监控平台
首先呢?从https://github.com/kubernetes/heapster获取源码,在heapster/deploy/kube-config/influxdb文件夹下将所有的yaml文件,使用kubectl create,这样就分别的到
了heapster,grafana,influxdb三种不同类型的pod。
比较重要的是:heapster.yaml中--source和--sink的配置:
https://github.com/nefuddos/heapster/blob/master/docs/sink-configuration.md
https://github.com/nefuddos/heapster/blob/master/docs/source-configuration.md
碰到的问题:
由于heapster收集集群信息需要一些时间,所以在dashboard上看到的cpu和mem信息会慢一些。
还有一次错误日志:
2017-09-16T02:45:40.136702919Z E0916 02:45:40.136411 1 influxdb.go:150] Failed to create infuxdb: failed to ping InfluxDB server at "monitoring-influxdb:8086" - Get http://monitoring-influxdb:8086/ping: dial tcp: lookup monitoring-influxdb on 10.254.0.2:53: server misbehaving
根据后面的信息,dial tcp xxx,说明heapster所在的pod访问kube-dns出现问题。查了一下,在kube-dns所在的那个机器上,所有的pod节点都不可访问。
于是将kube-dns.yaml手动制定一个可以访问的node节点上就可以了。
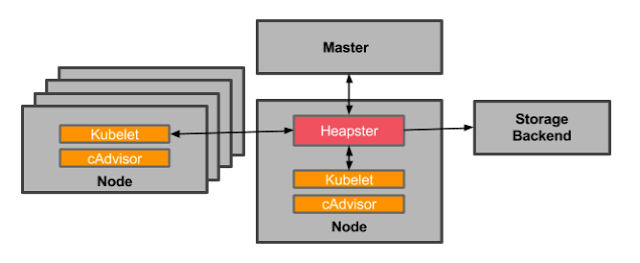
heapster结构图: