1. matplotlib ->绘图
2. numpy -> 处理数值型数组
3. pandas -> 处理字符串, 时间序列、字典等
一 . matplotlib (切记x,y 都必须是数字, 通过xticks , yticks 将字符串与数字对应)
1.基础练习
python的底层绘图库,主要做数据可视化图表.
简单示例:
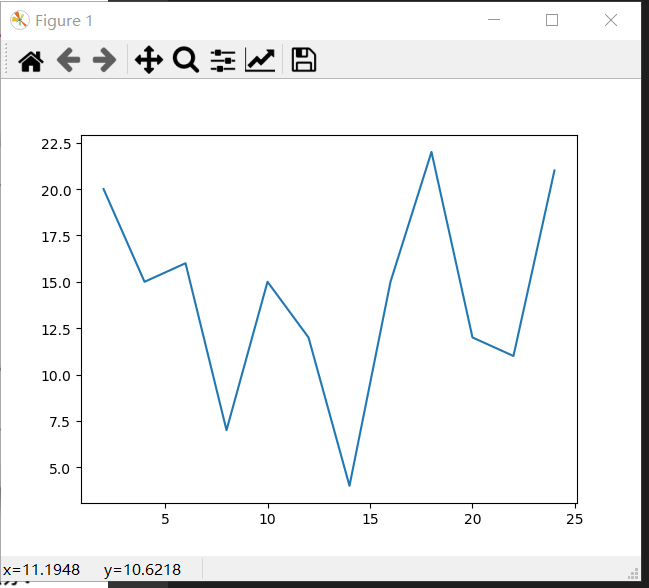
假设一天中每隔两个小时气温分别是
[20,15,16,7,15,12,4,15,22,12,11,21]
from matplotlib import pyplot as plt

x = range(2,26,2) # 准备x轴数据
y = [20,15,16,7,15,12,4,15,22,12,11,21] # 准备y轴数据

plt.plot(x,y) # 一一对应, 并通过plot绘制折线图
plt.show() # 展示
2.完善
-
设置图片大小
fig = plt.figure(figsize=(20, 8), dpi=80) # 全局设置,放在最前边,后边所有的plt都会使用这个配置 #(长,宽), dpi每英寸像素点数 -
图片保存
#图片绘制之后保存 plt.savefig("./t1.png") # 同昂可以保存为 .svg 格式 -
设置x, y轴刻度
_x = range(2, 25, 2)
_x_text = ["hello, {}".format(i) for i in _x]
# plt.xticks(_x, _x_text, rotation=90) # rotation 旋转90度 可选
plt.xticks(_x, _x_text) # _x_text 可选,
# _x, _x_text, 数据与 字符串一一对应
plt.yticks()
-
中文显示
matplotlib 默认不显示中文字体.
linux/mac: fc-list :lang=zh -> 查看支持的中文
win/linux
import matplotlib
font = {
    "family": "MicroSoft YaHei",
    "weight": "bold",
    "size": "10"
}
matplotlib.rc("font", **font)
mac
from matplotlib import font_manager mu_font = font_manager.FontProperties(fname="字体地址") plt.xticks(_x, _x_text, fontproperties=my_font) -
添加描述信息
plt.xlabel("时间") # 设置x轴label plt.ylabel("温度") # 设置y轴label plt.title("0点到24点温度变化") # 设置标题 # 可选参数, fontproperties -
绘制网格
plt.grid(alpha=0.3)
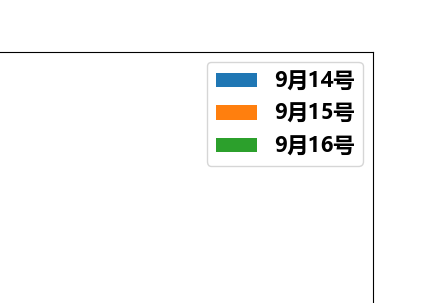
7.设置图例
plt.bar(_x_14, b_14, width=0.2, label="9月14号") # 14号的 plt.bar(_x_15, b_15, width=0.2, label="9月15号") # 15号的 plt.bar(_x_16, b_16, width=0.2, label="9月16号") # 16号的 plt.xticks(_x_15, a) # 设置图例 plt.legend() -
3.绘制散点图
plt.scatter(x,y) # 在一个表格里可以绘制多个
plt.scatter(x,y)
# 设置x,y坐标轴的值
4.绘制条形图
plt.bar(_x, _y, width=0.3) # width 条形图宽度, 可以是列表
5.绘制横着的条形图
plt.barh(_x, _y, height=0.3, color="颜色") # height 条形图宽度
练习:
a = ["猩球崛起3:终极之战", "敦刻尔克", "蜘蛛侠:英雄归来", "战狼2"] # 电影
b_16 = [15746, 312, 4497, 319] # 9月16号票房
b_15 = [12357, 156, 2045, 168]
b_14= [2358, 399, 2358, 362]
例:
from matplotlib import pyplot as plt
import matplotlib
font = {
    "family": "MicroSoft YaHei",
    "weight": "bold",
    "size": "15"
}
matplotlib.rc("font", **font)

a = ["猩球崛起3:终极之战", "敦刻尔克", "蜘蛛侠:英雄归来", "战狼2"]
b_16 = [15746, 312, 4497, 319]
b_15 = [12357, 156, 2045, 168]
b_14= [2358, 399, 2358, 362]

# 调整x轴间隔
_x_14 = [i+0.2 for i in range(len(a))]
_x_15 = [i+0.2*2 for i in range(len(a))]
_x_16 = [i+0.2*3 for i in range(len(a))]


plt.figure(figsize=(20, 8))
plt.bar(_x_14, b_14, width=0.2, label="9月14号") # 14号的
plt.bar(_x_15, b_15, width=0.2, label="9月15号") # 15号的
plt.bar(_x_16, b_16, width=0.2, label="9月16号") # 16号的

plt.xticks(_x_15, a)

plt.xlabel("电影名")
plt.ylabel("票房")
plt.title("9月14.15.16三天票房")
#  设置图例
plt.legend()

plt.show()
6.绘制直方图, 范围频率
hist前提条件: 初始数据, hist 帮忙处理
plt.hist(a, 20)
# a 是数据, 20 是分组
# 常用
bin_width=3 # 组距
num_bins = int((max(a)-min(a)/bin_width) # 组数
# 组内个数图
plt.hist(a, num_bins)  # 或者num_bins 传入数组,指定分组
# 所占比例图normed=True
plt.hist(a, num_bins, normed=True)
组数: 100 以内一般分5-12 组
组距: 每个小组两个端点的距离
组数=极差/组距
示例:
from matplotlib import pyplot as plt
from random import randint
a = [randint(50, 200) for i in range(200)]

bin_width = 5
plt.figure(figsize=(20, 8))
num_bins = int((max(a) - min(a))/bin_width)

plt.hist(a, num_bins)
plt.grid()

plt.show()
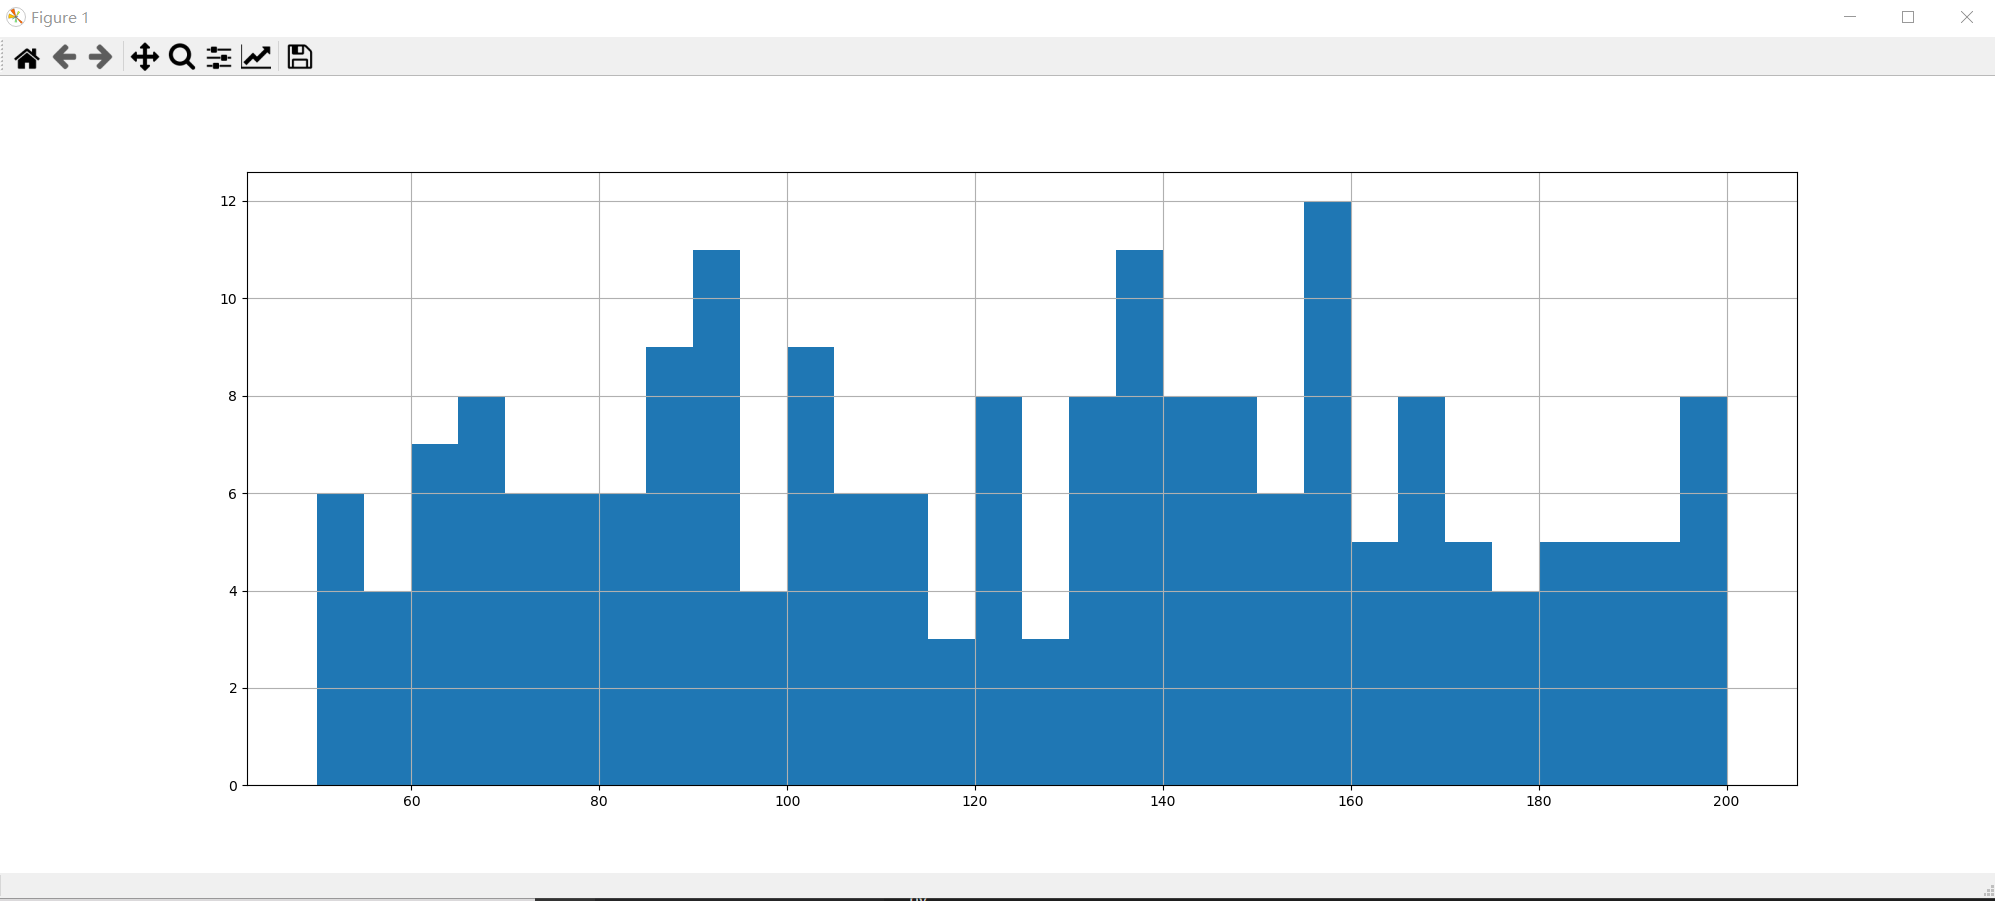
注意: 如果(max(a) - min(a))/bin_width 除不尽的话会有偏移
示例二:
interval = [0,5,10,15,20,25,30,35,40,45,60,90] # 分组端点
width = [5,5,5,5,5,5,5,5,5,15,30,60]
# 总人数
quantity = [836, 2737, 3723, 3926, 3596, 1438, 3273, 642, 824, 613, 215, 47]
from matplotlib import pyplot as plt
from random import randint
# 通过条状图绘制直方图
interval = [0,5,10,15,20,25,30,35,40,45,60,90, 150] # 分组端点
width = [5,5,5,5,5,5,5,5,5,15,30,60]
# 总人数
quantity = [836, 2737, 3723, 3926, 3596, 1438, 3273, 642, 824, 613, 215, 47]
plt.figure(figsize=(20, 8))

plt.bar(range(len(quantity)), quantity, width=1)
# 主要为这里, 设置x轴刻度
_x = [i - 0.5 for i in range(13)]
plt.xticks(_x, interval)

plt.grid()
plt.show()