-
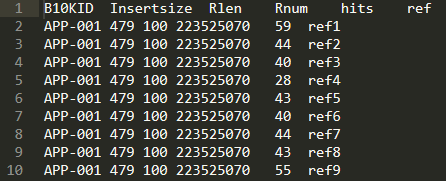
输入数据
-
Rscript
#读取数据
a<-read.table("../data/All.lib.list.modified.ref.hits.data1",header = T)

##对分类进行排序
a$ref=factor(a$ref,levels = c("ref1","ref2","ref3","ref4","ref5","ref6","ref7","ref8","ref9","ref10"))

##建立每个分面的R<sup>2</sup>值和p-value值
lm_labels<-function(dat){
  tmp = cor.test(dat$Rnum,dat$hits,method="pearson")
  r<-sprintf("italic(R^2)==%.3f", tmp$estimate)
  p<-sprintf("italic(p-vaule)==%.3f",tmp$p.value)
  data.frame(r=r,p=p,stringsAsFators=FALSE)
}
library(plyr)
labels<-ddply(a,"ref",lm_labels)

##使用ggplot画图
library(ggplot2)
p<-ggplot(data=a,aes(x=Rnum/1000000,y=hits,color=ref))+
  geom_point()+stat_smooth()+
  theme(axis.text.x=element_text(size=8,vjust=1,hjust=1,angle=45))+
  facet_wrap(.~ref,nrow=2)+
  scale_x_continuous(breaks=seq(100,1500, 100))+
  geom_text(x=300,y=500,aes(label=r),data=labels,parse=TRUE)+
  geom_text(x=300,y=450,aes(label=p),data=labels,parse=TRUE)
p
- 输出的结果
