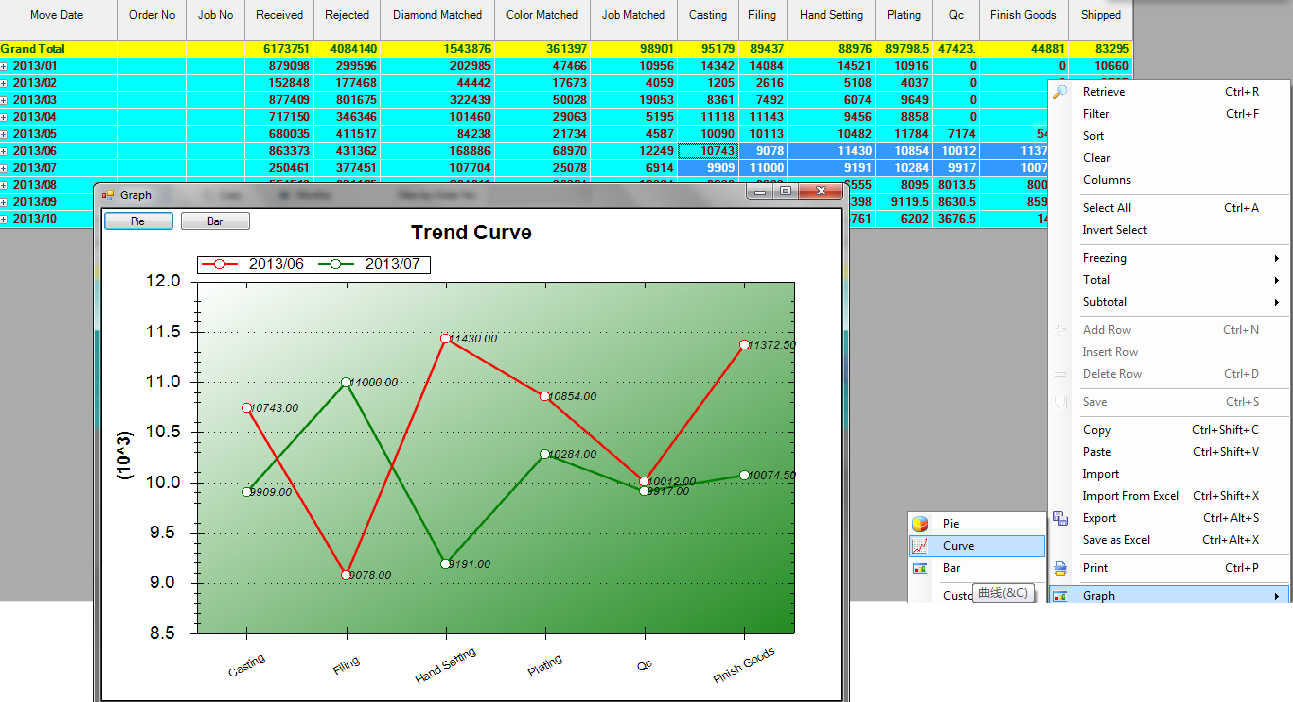
这几天做了个自己觉得还蛮NB的功能,在GRID中选中一块数据,然后右键菜单即可生成三种图形,还可以互相切换,对了,饼图还添加了鼠标点击分离的处理,大致如图:
用的控件就是ZedGraph,我把它继承封装了一下,方便调用:
  1 Imports ZedGraph
  2
  3 Public Class MyGraph
  4     '用于切换图型的
  5     Private dtSource As DataTable
  6
  7     Private Function MyGraph_MouseDownEvent(ByVal sender As ZedGraph.ZedGraphControl, ByVal e As System.Windows.Forms.MouseEventArgs) As System.Boolean Handles MyBase.MouseDownEvent
  8
  9         If e.Button = Windows.Forms.MouseButtons.Left Then
 10             Dim pane As GraphPane = sender.GraphPane
 11             Dim pt As New PointF(e.X, e.Y)
 12             Dim curve As CurveItem = Nothing
 13             Dim i%
 14             If pane.FindNearestPoint(pt, curve, i) Then
 15                 If curve.IsPie Then
 16                     Dim pi As PieItem = CType(curve, PieItem)
 17                     If pi.Displacement > 0 Then
 18                         pi.Displacement = 0
 19                     Else
 20                         pi.Displacement = 0.3
 21                     End If
 22                     sender.Refresh()
 23                 End If
 24             End If
 25         End If
 26         Return True
 27
 28     End Function
 29
 30     Public Sub SetTitle(ByVal title As String)
 31         '' Set the pane title
 32         GraphPane.Title.Text = title
 33     End Sub
 34
 35     Public Sub SetPieDataB(ByVal dt As DataTable, ByVal title As String)
 36
 37         '为多列一行的数据,按列分块,不支持切换,不推荐使用
 38
 39         Dim ds As New DataSet
 40         Dim i, j As Integer
 41         Dim cc, rc As Integer
 42
 43         rc = dt.Rows.Count
 44         cc = dt.Columns.Count
 45         If rc = 0 Or cc = 0 Then Return
 46
 47         GraphPane.CurveList.Clear()
 48         GraphPane.GraphObjList.Clear()
 49         GraphPane.Legend.IsVisible = True
 50         GraphPane.Legend.Position = LegendPos.Right
 51         GraphPane.Legend.FontSpec.Size = 7
 52         If String.IsNullOrEmpty(title) = False Then
 53             GraphPane.Title.Text = title
 54         End If
 55
 56         Dim labels(cc - 1) As String
 57         Dim values(cc - 1) As Double
 58
 59         For i = 0 To cc - 1
 60             labels(i) = dt.Columns(i).ColumnName
 61             values(i) = dt.Rows(0).Item(i)
 62         Next
 63         'Dim colors() As Color = {Color.Red, Color.Blue, Color.Green, Color.Yellow, Color.Purple, Color.Brown, Color.Coral, Color.ForestGreen}
 64         Dim slices() As PieItem = GraphPane.AddPieSlices(values, labels)
 65         GraphPane.Fill = New Fill(Color.Cornsilk)
 66         GraphPane.Chart.Fill = New Fill(Color.Cornsilk)
 67         'GraphPane.Fill = New Fill(Color.White, Color.Goldenrod, 45.0F)
 68
 69         For i = 0 To cc - 1
 70             slices(i).LabelType = PieLabelType.Name_Value_Percent
 71         Next
 72
 73         GraphPane.AxisChange()
 74         Refresh()
 75         dtSource = Nothing
 76         FlowLayoutPanel1.Controls.Clear()
 77
 78     End Sub
 79
 80     Public Sub SetPieData(ByVal dt As DataTable, ByVal title As String)
 81
 82         'TABLE内容应为第一列为各块名称,第二列为各块的值,不能只有一列
 83
 84         Dim ds As New DataSet
 85         Dim i, j As Integer
 86         Dim cc, rc As Integer
 87
 88         rc = dt.Rows.Count
 89         cc = dt.Columns.Count
 90         If rc = 0 Or cc <= 1 Then Return
 91
 92         GraphPane.CurveList.Clear()
 93         GraphPane.GraphObjList.Clear()
 94         GraphPane.Legend.IsVisible = True
 95         GraphPane.Legend.Position = LegendPos.Right
 96         GraphPane.Legend.FontSpec.Size = 7
 97         If String.IsNullOrEmpty(title) = False Then
 98             GraphPane.Title.Text = title
 99         End If
100
101         Dim labels(rc - 1) As String
102         Dim values(rc - 1) As Double
103
104         For j = 1 To cc - 1
105             For i = 0 To rc - 1
106                 labels(i) = dt.Rows(i).Item(0)
107                 values(i) = dt.Rows(i).Item(j)
108             Next
109             'Dim colors() As Color = {Color.Red, Color.Blue, Color.Green, Color.Yellow, Color.Purple, Color.Brown, Color.Coral, Color.ForestGreen}
110             Dim slices() As PieItem = GraphPane.AddPieSlices(values, labels)
111             GraphPane.Fill = New Fill(Color.Cornsilk)
112             GraphPane.Chart.Fill = New Fill(Color.Cornsilk)
113             'GraphPane.Fill = New Fill(Color.White, Color.Goldenrod, 45.0F)
114
115             For i = 0 To rc - 1
116                 slices(i).LabelType = PieLabelType.Name_Value_Percent
117             Next
118         Next
119
120         GraphPane.AxisChange()
121         Refresh()
122         dtSource = dt
123
124         FlowLayoutPanel1.Controls.Clear()
125         AddButton("Curve", AddressOf btnCurve_Click)
126         AddButton("Bar", AddressOf btnBar_Click)
127
128     End Sub
129
130     Public Sub SetPieData(ByVal dt As DataTable)
131
132         SetPieData(dt, "")
133
134     End Sub
135
136     Public Sub SetCurveData(ByVal dt As DataTable)
137         SetCurveData(dt, "", "", "")
138     End Sub
139
140     Public Sub SetCurveData(ByVal dt As DataTable, ByVal title As String)
141         SetCurveData(dt, title, "", "")
142     End Sub
143
144     Public Sub SetCurveData(ByVal dt As DataTable, ByVal title As String, ByVal xAxisTitle As String, ByVal yAxisTitle As String)
145
146         'TABLE内容应为第一列为X轴值,第二列开始为Y轴数值,除非只有一列
147
148         If dt Is Nothing Then Return
149
150         Dim cc As Integer = dt.Columns.Count
151         Dim rc As Integer = dt.Rows.Count
152
153         If rc = 0 Or cc = 0 Then Return
154
155         GraphPane.CurveList.Clear()
156         GraphPane.GraphObjList.Clear()
157
158         If String.IsNullOrEmpty(title) = False Then
159             GraphPane.Title.Text = title
160         End If
161         If String.IsNullOrEmpty(xAxisTitle) Then
162             GraphPane.XAxis.Title.Text = xAxisTitle
163         End If
164         If String.IsNullOrEmpty(yAxisTitle) Then
165             GraphPane.YAxis.Title.Text = yAxisTitle
166         End If
167
168         GraphPane.Legend.IsVisible = cc > 1
169         GraphPane.Legend.Position = LegendPos.Top
170
171         Dim values(rc - 1) As Double
172         Dim labels(rc - 1) As String
173
174         Dim i%, j%, k%, b%
175         Dim alone As Boolean = cc = 1
176         '只有一列的情况下,X轴为序号
177         For i = 0 To rc - 1
178             If alone Then
179                 labels(i) = i + 1
180             Else
181                 labels(i) = dt.Rows(i).Item(0)
182             End If
183         Next
184
185         Dim colors() As Color = {Color.Red, Color.Green, Color.Blue, Color.Orange, Color.Purple, Color.Pink}
186         Dim curve As LineItem
187         b = IIf(alone, 0, 1)
188         For j = b To dt.Columns.Count - 1
189             For i = 0 To dt.Rows.Count - 1
190                 values(i) = dt.Rows(i).Item(j)
191             Next
192             k = j - b
193             If k >= colors.Length Then
194                 k = j - b - colors.Length
195             End If
196             curve = GraphPane.AddCurve(dt.Columns(j).ColumnName, Nothing, values, colors(k), SymbolType.Circle)
197             curve.Line.Width = 2.5
198             curve.Line.IsAntiAlias = True
199             curve.Symbol.Fill = New Fill(Color.White)
200             curve.Symbol.Size = 8
201
202             For i = 0 To curve.Points.Count - 1
203                 Dim pt As PointPair = curve.Points(i)
204                 Dim text As New TextObj(pt.Y.ToString("f2"), pt.X, pt.Y + GraphPane.YAxis.Scale.Max * 0.02, CoordType.AxisXYScale, AlignH.Left, AlignV.Center)
205                 text.ZOrder = ZOrder.A_InFront
206                 text.FontSpec.Size = 9
207                 text.FontSpec.Border.IsVisible = False
208                 text.FontSpec.Fill.IsVisible = False
209                 'text.FontSpec.Fill = new Fill( Color.FromArgb( 100, Color.White ) )
210                 text.FontSpec.IsItalic = True
211                 'text.FontSpec.Angle = 30  '字体倾斜度
212                 GraphPane.GraphObjList.Add(text)
213             Next
214
215         Next
216         GraphPane.Chart.Fill = New Fill(Color.White, Color.FromArgb(255, Color.ForestGreen), 45.0F)
217
218         GraphPane.XAxis.Scale.TextLabels = labels
219         GraphPane.XAxis.Type = AxisType.Text
220         GraphPane.XAxis.Scale.FontSpec.Size = 9
221         If labels.Length > 4 And labels(0).Length > 4 Then
222             GraphPane.XAxis.Scale.FontSpec.Angle = 30
223         End If
224         GraphPane.XAxis.IsVisible = True
225         GraphPane.YAxis.IsVisible = True
226         GraphPane.YAxis.MajorGrid.IsVisible = True
227
228         GraphPane.AxisChange()
229         Refresh()
230         dtSource = dt
231
232         FlowLayoutPanel1.Controls.Clear()
233         AddButton("Pie", AddressOf btnPie_Click)
234         AddButton("Bar", AddressOf btnBar_Click)
235
236     End Sub
237
238     Public Sub SetBarData(ByVal dt As DataTable)
239         SetBarData(dt, Nothing, Nothing, Nothing)
240     End Sub
241
242     Public Sub SetBarData(ByVal dt As DataTable, ByVal title As String)
243         SetBarData(dt, title, Nothing, Nothing)
244     End Sub
245
246     Public Sub SetBarData(ByVal dt As DataTable, ByVal title As String, ByVal xAxisTitle As String, ByVal yAxisTitle As String)
247
248         'TABLE内容应为第一列为X轴值,第二列开始为Y轴数值,除非只有一列
249
250         Dim cc As Integer = dt.Columns.Count
251         Dim rc As Integer = dt.Rows.Count
252
253         If cc = 0 Or rc = 0 Then Return
254
255         Dim x(rc - 1) As Double
256         Dim values(rc - 1) As Double
257         Dim labels(rc - 1) As String
258
259         GraphPane.CurveList.Clear()
260         GraphPane.GraphObjList.Clear()
261         If String.IsNullOrEmpty(title) = False Then
262             GraphPane.Title.Text = title
263         End If
264         If String.IsNullOrEmpty(xAxisTitle) Then
265             GraphPane.XAxis.Title.Text = xAxisTitle
266         End If
267         If String.IsNullOrEmpty(yAxisTitle) Then
268             GraphPane.YAxis.Title.Text = yAxisTitle
269         End If
270         GraphPane.Legend.IsVisible = cc > 1
271         GraphPane.Legend.Position = LegendPos.Top
272
273         Dim i%, j%, k%, b%
274         Dim alone As Boolean = cc = 1
275         Dim bi As BarItem
276
277         '只有一列的情况下,X轴为序号
278         For i = 0 To rc - 1
279             If alone Then
280                 labels(i) = i + 1
281             Else
282                 labels(i) = dt.Rows(i).Item(0)
283             End If
284         Next
285
286         If alone Then
287             For i = 0 To rc - 1
288                 x(i) = i + 1
289                 values(i) = dt.Rows(i).Item(0)
290             Next
291             bi = GraphPane.AddBar(dt.Columns(0).ColumnName, x, values, Color.Blue)
292             bi.Bar.Fill = New Fill(Color.Blue, Color.White, Color.Green)
293         Else
294             Dim colors() As Color = {Color.Red, Color.Green, Color.Blue, Color.Orange, Color.Purple, Color.Pink}
295
296             For j = 1 To dt.Columns.Count - 1
297                 For i = 0 To rc - 1
298                     values(i) = dt.Rows(i).Item(j)
299                 Next
300                 k = j - 1
301                 If k >= colors.Length Then
302                     k = j - 1 - colors.Length
303                 End If
304                 bi = GraphPane.AddBar(dt.Columns(j).ColumnName, Nothing, values, colors(k))
305                 bi.Bar.Fill = New Fill(colors(k), Color.White, colors(k))
306             Next
307
308             For i = 0 To bi.Points.Count - 1
309                 Dim pt As PointPair = bi.Points(i)
310                 Dim text As New TextObj(pt.Y.ToString("f2"), pt.X, pt.Y + GraphPane.YAxis.Scale.Max * 0.02, CoordType.AxisXYScale, AlignH.Left, AlignV.Center)
311                 text.ZOrder = ZOrder.A_InFront
312                 text.FontSpec.Size = 9
313                 text.FontSpec.Border.IsVisible = False
314                 text.FontSpec.Fill.IsVisible = False
315                 text.FontSpec.IsItalic = True
316                 GraphPane.GraphObjList.Add(text)
317             Next
318
319         End If
320
321         GraphPane.Chart.Fill = New Fill(Color.White, Color.FromArgb(255, Color.ForestGreen), 45.0F)
322
323         'GraphPane.XAxis.Scale.TextLabels = labels
324         GraphPane.XAxis.Type = AxisType.Text
325         GraphPane.XAxis.Scale.FontSpec.Size = 9
326         If labels.Length > 4 And labels(0).Length > 4 Then
327             GraphPane.XAxis.Scale.FontSpec.Angle = 30
328         End If
329         GraphPane.XAxis.IsVisible = True
330         GraphPane.YAxis.IsVisible = True
331         GraphPane.YAxis.MajorGrid.IsVisible = True
332
333         GraphPane.AxisChange()
334         Refresh()
335         dtSource = dt
336
337         FlowLayoutPanel1.Controls.Clear()
338         AddButton("Pie", AddressOf btnPie_Click)
339         AddButton("Curve", AddressOf btnCurve_Click)
340
341     End Sub
342
343     Private Sub AddButton(ByVal text As String, ByVal clickEvent As EventHandler)
344         Dim btn As New Button
345         btn.Text = text
346         AddHandler btn.Click, clickEvent
347         FlowLayoutPanel1.Controls.Add(btn)
348     End Sub
349
350     Private Sub btnPie_Click(ByVal sender As Object, ByVal e As System.EventArgs)
351         If dtSource Is Nothing Then Return
352
353         SetPieData(dtSource, CType(sender, Button).Text)
354     End Sub
355
356     Private Sub btnCurve_Click(ByVal sender As Object, ByVal e As System.EventArgs)
357         If dtSource Is Nothing Then Return
358
359         SetCurveData(dtSource, CType(sender, Button).Text)
360     End Sub
361
362     Private Sub btnBar_Click(ByVal sender As Object, ByVal e As System.EventArgs)
363         If dtSource Is Nothing Then Return
364
365         SetBarData(dtSource, CType(sender, Button).Text)
366     End Sub
367
368     Private Sub FinexGraph_Resize(ByVal sender As System.Object, ByVal e As System.EventArgs) Handles MyBase.Resize
369         GraphPane.AxisChange()
370         Refresh()
371     End Sub
372 End Class
注意,我拖了个FlowLayoutPanel1放在控件最上面,放切换图型按钮的
调用方法很简单,把它拖到FORM上,然后准备好数据源(datatable),完了调用控件的setxxxdata()方法即可,当然我这里是在GRID的菜单点击后弹出个窗口来显示的