1.raphael.js svg画图的开源库,支持IE8+
官方api: http://dmitrybaranovskiy.github.io/raphael/reference.html
Github地址: https://github.com/DmitryBaranovskiy/raphael/
2.js引用
//raphael.js主库
<script src="./raphael.js" type="text/javascript"></script>
//raphael.js扩展库,可实现局部元素拖拽,背景画布拖拽缩放等
<script src="./raphael.extension.js" type="text/javascript"></script>
3.初始化
假设页面上有两个画布需要同时绘制
<div id="main1" class="main main1" style="250px;height:300px;">
</div>
<div id="main2" class="main main2" style="250px;height:300px;">
</div>
js初始化部分:
var paper1=Raphael.createNew(document.getElementsByClassName('main')[0], 500, 400);
var paper2=Raphael.createNew(document.getElementsByClassName('main')[1], 500, 400);
//第一个参数(必选)为绘制主函数,此处设置为init函数(具体实现在下方),
//第二个参数(可选)为true表示每次绘制清除画布,false不清除画布,
//第三个参数(可选)为任意类型,是用户传给绘制主函数的自定义额外参数。
paper1.draw(init,true,{type:"post"});
paper2.draw(init);
//绘制主函数的实现,第一个参数(必选)为当前raphael实例,第二个参数(可选)为用户自定义额外参数(与上方draw函数的第三个参数对应)
function init(paper,data){
console.log("start ,extra params:",data);
//画圆
var cir1=paper.circle(15,15,10).attr({
fill:"red", //填充色
stroke:"blue", //边缘线
"stroke-width":4 //
});
//矩形,起始点x,y,width,height
var rect1=paper.rect(40,25,60,40).attr({fill:"red",stroke:"green"});
var rect2=paper.rect(110,25,60,40,5).attr({fill:"red",stroke:"green"});
//椭圆
var ellipse1 = paper.ellipse(15,55,10,20).attr({
"fill":"#17A9C6", // background color of the ellipse
"stroke":"#2A6570", // ellipse's border color
"stroke-width":2 // border width
});
//M 移动到(moveTo) (x y)+
//Z 闭合路径(closepath) (none)
//L 直线(lineTo) (x y)+
//H 水平直线 x+
//V 垂直直线 y+
//C 曲线(curveto) (x1 y1 x2 y2 x y)+
//S 平滑曲线 (x2 y2 x y)+
//Q 二次贝赛尔曲线 (x1 y1 x y)+
//T 平滑二次贝塞尔曲线 (x y)+
//A 椭圆弧 (rx ry x-axis-rotation large-arc-flag sweep-flag x y)+
//R Catmull-Rom 曲线* x1 y1 (x y)+
//绘制路径
paper.path("M 40,40 H 90 V 60 H 70 V 110 H 60 V 60 H 40 z").attr({
"fill": "#5DDEF4",
"stroke": "#2A6570",
"stroke-width": 2
});
//2、三角形使用Path命令L
paper.path("M130,30 L200,30 L160,90 z").attr({
"fill": "#5DDEF4",
"stroke": "#2A6570",
"stroke-width": 2
});
//3、T形使用Path命令H,V
paper.path("M 40,40 H 90 V 60 H 70 V 110 H 60 V 60 H 40 z").attr({
"fill": "#5DDEF4",
"stroke": "#2A6570",
"stroke-width": 2
});
//4、2次贝塞尔曲线形,使用path命令Q
paper.path("M240,40L300,40L300,100");
paper.path("M240,40Q300,40 300,100").attr('stroke', 'red');
//5、2次贝塞尔曲线形,使用path命令Q和T(第一个是正常绘制,第二个光滑连接)
paper.path('M10,250 L90,130 L160,160 L250,190 L250,70');
paper.path('M10,250 Q90,130 160,160 T250,70').attr('stroke', 'red');
//6、绘制3次贝赛尔曲线,使用命令C,平滑画线使用命令S
paper.path('M320,120 L350,180 L450,260 L480,140');
paper.path('M320,120 C350,180 450,260 480,140').attr('stroke', 'red');
paper.path('M320,120 S450,260 480,140').attr('stroke', 'yellow');
//transform
//T 平移|S 缩放 | R 按角度旋转| M 变换矩阵
var rect2=paper.rect(110,95,60,40,5).attr({fill:"red",stroke:"green"}).transform("r90t20,0");
//rect2.animate(
// { "width":"300", "height":"200" },
// 500,
// 'bounce',
// function(){ }
//);
var text1=paper.text(110,195,"你");//.attr({"font-size":"10px"});
var text1=paper.text(120,195,"好");
var rect3=paper.rect(110,195,60,40,5).attr({fill:"red",stroke:"green"});
//“linear”(线性)
//“<”或“easeIn”或“ease-in” (由慢到快)
//“>”或“easeOut”或“ease-out”(又快到慢)
//“<>”或“easeInOut”或“ease-in-out”(由慢到快再到慢)
//“backIn”或“back-in”(开始时回弹)
//“backOut”或“back-out”(结束时回弹)
//“elastic”(橡皮筋)
//“bounce”(弹跳)
//rect3.animate({
// transform: "r90,110,195t100,0s1.5"
//},2000,"backOut",function(){console.log("finish");})
//rect3.click(function(){
// alert("hahah!");
// });
rect3.data({
id:1,
name:"n1"
});
rect3.data({
id:2,
type:"test"
})
rect3.removeData("id")
rect3.dblclick(function(){
alert("It's a double click !"+rect3.data("name"));
})
var cir2=paper.circle(110,250,30);
var newCircle2=cir2.clone();
var newBBox2=newCircle2.getBBox();
console.log(newBBox2)
paper.rect(newBBox2.x,newBBox2.y,newBBox2.width,newBBox2.height);
//toFront() 、toBack() 、hide() 、show() 、remove()
//清空
//paper.clear()
var img1=paper.image("./favicon.ico",105,245,10,10);
paper.setSize(600,800);
var raphaelSet = paper.set();
raphaelSet.push(rect3,cir2);
// raphaelSet.splice(1, 1, cir, cir1, cir2);
raphaelSet.forEach(function(ele){
ele.attr({
"fill": "red"
});
console.log(ele[0]);
})
//raphaelSet.clear()
raphaelSet.attr({
"fill": "red"
});
console.log("paper",paper);
paper.setViewBox(00,0,200,200,false)
//paper.scale(1.3,1.3);
//元素可拖拽
img1.draggable();
//背景画布可拖拽
paper.draggable();
text1.toFront()
setTimeout(function(){
text1.animate({
transform:"r360,115,200t10,25",
"font-size":30
},3000)
},3000)
window.paper=paper;
}
//缩放函数
function zoom(num,paper){
var paper=paper || window.paper;
if(num>0 ){
paper.zoomIn();
}
if(num<0 ){
paper.zoomOut();
}
if(num==0){
paper.zoom(1);
}
}
4.实例应用
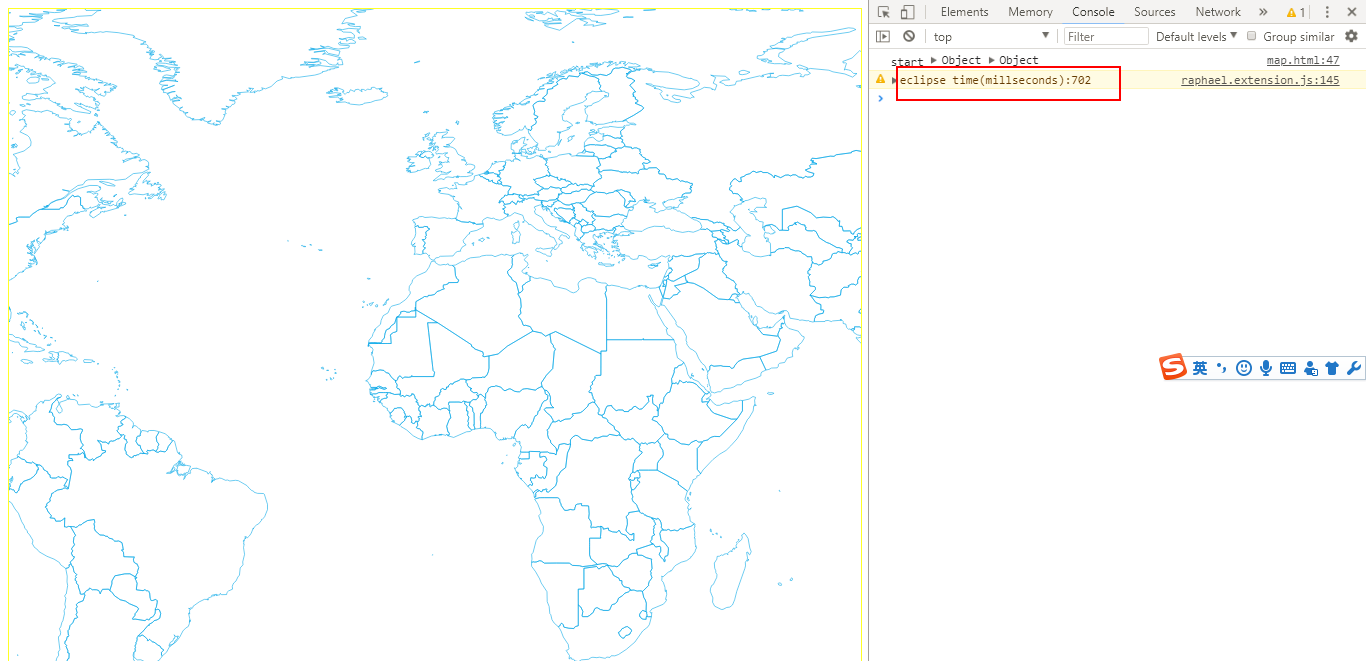
偶然在一个商业js项目里找到一幅世界地图的json文件,借此试了试raphael的效率如何。
贴出代码:
<!DOCTYPE html>
<html>

<head>
    <title></title>
    <meta charset="UTF-8" />
    <meta http-equiv="content-type" content="text/html; charset=utf-8">
    <meta http-equiv=X-UA-Compatible content="IE=edge">
    <style>
        canvas {
            width: 100%;
            height: 100%;
        }

        body {
            overflow: hidden;
            padding: 0;
        }

        .main {
            width: 100%;
            height: 100%;
            padding: 0px;
            margin: auto;
            overflow: hidden;
            border: 1px solid yellow;
        }
    </style>
</head>

<body>
    <div id="main1" class="main main1">

    </div>
    <!-- 在此用jquery主要是为了map.json文件的读取及数组遍历省事 -->
    <script src="./jquery-2.2.0.js" type="text/javascript"></script>
    <script src="./raphael.js" type="text/javascript"></script>
    <script src="./raphael.extension.js" type="text/javascript"></script>
    <!-- http://www.hightopo.com/demo/large-screen/index.html -->
    <script src="./map.json"></script>

    <script type="text/javascript">
        function train(result) {
            console.log(result)
        }

        function init(paper, data) {
            console.log("start", data, window.jsonFile);

            var map = window.jsonFile;
            $.each(map.comps, function(i, e) {

                var pathStr = "";
                $.each(e.points, function(ii, ee) {
                    if (ii == 0) {
                        pathStr = "M" + ee;
                    } else {
                        if (e.segments) {
                            if (ii % 2 == 0 && e.segments[ii / 2] == 1) {
                                pathStr += ",M" + ee;
                            } else if (ii % 2 == 0 && e.segments[ii / 2] != 1) {
                                pathStr += ",L" + ee;
                            } else if (ii % 2 != 0) {
                                pathStr += "," + ee;
                            }
                        } else {
                            if (ii % 2 == 0) {
                                pathStr += ",L" + ee;
                            } else {
                                pathStr += "," + ee;
                            }
                        }


                    }

                });

                paper.path(pathStr)
                    .attr({
                        "stroke-width": e.borderWidth,
                        stroke: e.borderColor,
                    })
            });


            paper.draggable();
        }
        var paper1 = Raphael.createNew(document.getElementsByClassName('main')[0], $(window).width(), $(window).height());
        paper1.draw(init, true, {
            type: "post"
        });
        //setInterval(function(){
        //    paper1.draw(init,true);
        //    paper2.draw(init,true);
        //},2000);
    </script>
</body>

</html>
效果展示;