<template>
<div>
<Row style="margin-bottom: 20px;">
<Col span="5">
<Card style="250px; height: 140px;">
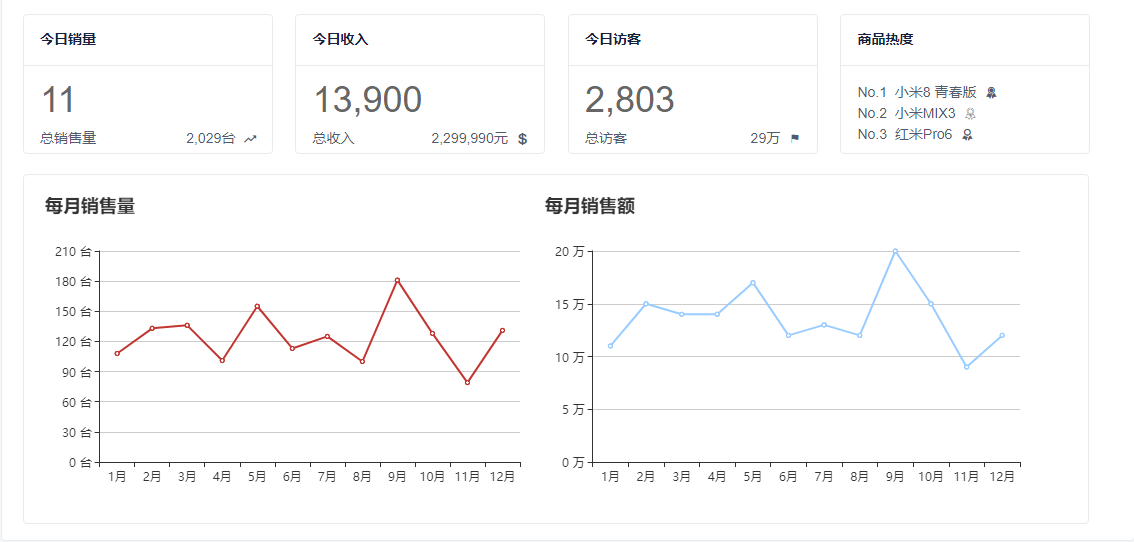
<p slot="title">今日销量</p>
<div class="card-list">
<p><span class="card-big-font">11</span></p>
<p style="font-size: 14px;padding-top: 10px;">
总销售量
<span class="card-span-color"><span>2,029台</span>
<Icon type="md-trending-up" /></span>
</p>
</div>
</Card>
</Col>
<Col span="5" offset="1">
<Card style="250px; height: 140px;">
<p slot="title">今日收入</p>
<p><span class="card-big-font">13,900</span></p>
<p style="font-size: 14px;padding-top: 10px;">
总收入
<span class="card-span-color"><span>2,299,990元</span>
<Icon type="logo-usd" /></span>
</p>
</Card>
</Col>
<Col span="5" offset="1">
<Card style="250px; height: 140px;">
<p slot="title">今日访客</p>
<p><span class="card-big-font">2,803</span></p>
<p style="font-size: 14px;padding-top: 10px;">
总访客
<span class="card-span-color"><span>29万</span>
<Icon type="ios-flag" /></span>
</p>
</Card>
</Col>
<Col span="5" offset="1">
<Card style="250px; height: 140px;">
<p slot="title">商品热度</p>
<p style="font-size: 14px;">
No.1 <span>小米8 青春版</span>
<Icon type="ios-ribbon" /></span>
</p>
<p style="font-size: 14px;">
No.2 <span>小米MIX3</span>
<Icon type="ios-ribbon-outline" /></span>
</p>
<p style="font-size: 14px;">
No.3 <span>红米Pro6</span>
<Icon type="md-ribbon" /></span>
</p>
</Card>
</Col>
</Row>
<Row>
<Col span="11">
<Card style="1066px; height: 350px;">
<div id="main" :style="{'500px',height: '300px'}" style="float: left;"></div>
<div id="echarts" :style="{'500px', height: '300px'}" style="float: left;"></div>
</Card>
</Col>
</Row>
</div>
</template>
<script>
import echarts from 'echarts'
export default {
data() {
return {
isCollapsed: false,
charts: ''
};
},
methods: {
drawPie(id) {
this.charts = echarts.init(document.getElementById(id))
this.charts.setOption({
title: {
text: '每月销售量'
},
xAxis: {
type: 'category',
data: ['1月', '2月', '3月', '4月', '5月', '6月', '7月', '8月', '9月', '10月', '11月', '12月']
},
tooltip: {
trigger: 'axis'
},
grid: {
left: '3%',
right: '4%',
bottom: '3%',
containLabel: true
},
yAxis: {
type: 'value',
axisLabel: {
formatter: '{value} 台'
}
},
series: [{
name: '销售量',
type: 'line',
data: [108, 133, 136, 101, 155, 113, 125, 100, 181, 128, 79, 131]
}]
})
},
drawPie2(id) {
this.charts = echarts.init(document.getElementById(id))
this.charts.setOption({
title: {
text: '每月销售额'
},
xAxis: {
type: 'category',
data: ['1月', '2月', '3月', '4月', '5月', '6月', '7月', '8月', '9月', '10月', '11月', '12月']
},
tooltip: {
trigger: 'axis'
},
grid: {
left: '3%',
right: '4%',
bottom: '3%',
containLabel: true
},
yAxis: {
type: 'value',
axisLabel: {
formatter: '{value} 万'
}
},
series: [{
name: '销售额',
type: 'line',
stack: '总量',
itemStyle: {
normal: {
color: '#99CCFF',
lineStyle: {
color: '#99CCFF'
}
}
},
data: [11, 15, 14, 14, 17, 12, 13, 12, 20, 15, 9, 12]
}]
})
}
},
//调用
mounted() {
this.$nextTick(function() {
this.drawPie('main')
this.drawPie2('echarts')
})
},
computed: {
menuitemClasses: function() {
return [
'menu-item',
this.isCollapsed ? 'collapsed-menu' : ''
]
}
}
}
</script>
<style scoped="scoped">
.card-big-font {
font-size: 36px;
color: #666;
line-height: 36px;
padding: 5px 0 10px;
text-overflow: ellipsis;
word-break: break-all;
white-space: nowrap;
margin-bottom: 5px;
}
.card-span-color {
position: absolute;
right: 15px;
}
</style>
效果图: