- Concept in English
- Coding Portion
- 评估回归的性能指标——R平方指标
- 比较分类和回归
Continuous supervised learning 连续变量监督学习
Regression 回归
Continuous:有一定次序,且可以比较大小
一、Concept in English
Slope: 斜率
Intercept: 截距
coefficient:系数
二、Coding Portion
Google: sklearn regression
import numpy
import matplotlib.pyplot as plt

from ages_net_worths import ageNetWorthData

ages_train, ages_test, net_worths_train, net_worths_test = ageNetWorthData()


from sklearn.linear_model import LinearRegression

reg = LinearRegression()
reg.fit(ages_train, net_worths_train)

### get Katie's net worth (she's 27)
### sklearn predictions are returned in an array, so you'll want to index into
### the output to get what you want, e.g. net_worth = predict([[27]])[0][0] (not
### exact syntax, the point is the [0] at the end). In addition, make sure the
### argument to your prediction function is in the expected format - if you get
### a warning about needing a 2d array for your data, a list of lists will be
### interpreted by sklearn as such (e.g. [[27]]).
km_net_worth = 1.0 ### fill in the line of code to get the right value
km_net_worth = reg.predict([[27]])[0][0]
### get the slope
### again, you'll get a 2-D array, so stick the [0][0] at the end
slope = 0. ### fill in the line of code to get the right value
slope = reg.coef_[0][0]
#print reg.coef_

### get the intercept
### here you get a 1-D array, so stick [0] on the end to access
### the info we want
intercept = 0. ### fill in the line of code to get the right value
intercept = reg.intercept_[0]

### get the score on test data
test_score = 0. ### fill in the line of code to get the right value
test_score = reg.score(ages_test,net_worths_test)

### get the score on the training data
training_score = 0. ### fill in the line of code to get the right value
training_score = reg.score(ages_train,net_worths_train)


### print all the value
def submitFit():
    # all of the values in the returned dictionary are expected to be
    # numbers for the purpose of the grader.
    return {"networth":km_net_worth,
            "slope":slope,
            "intercept":intercept,
            "stats on test":test_score,
            "stats on training": training_score}
三、评估回归的性能指标
评估拟合程度
3.1 最小化误差平方和
SSE sum of Squared Errors
- 相关算法实现
1.Ordinary Least Squares(OLS,普通最小二乘法)
2.Gradient Descent (梯度下降算法)
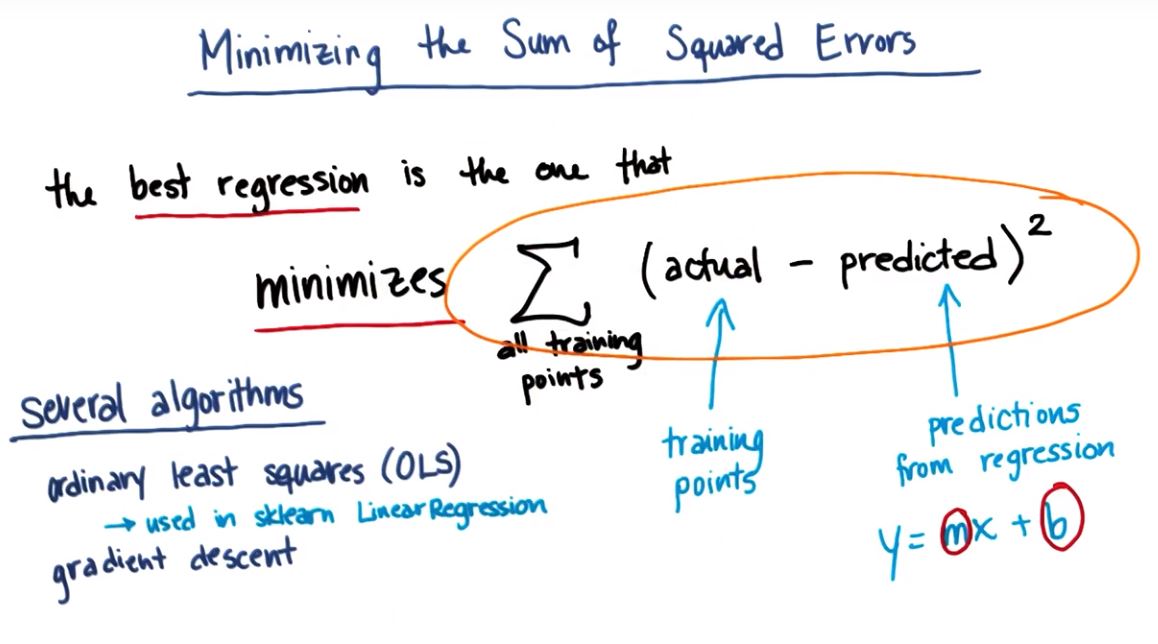
不足: 添加的数据越多,误差平方的和必然增加,但并不代表拟合程度不好
解决方案: R平方指标
3.2 R平方指标
r平方越高,性能越好(MAX = 1)
定义: 有多少输出的改变能用输入的改变解释
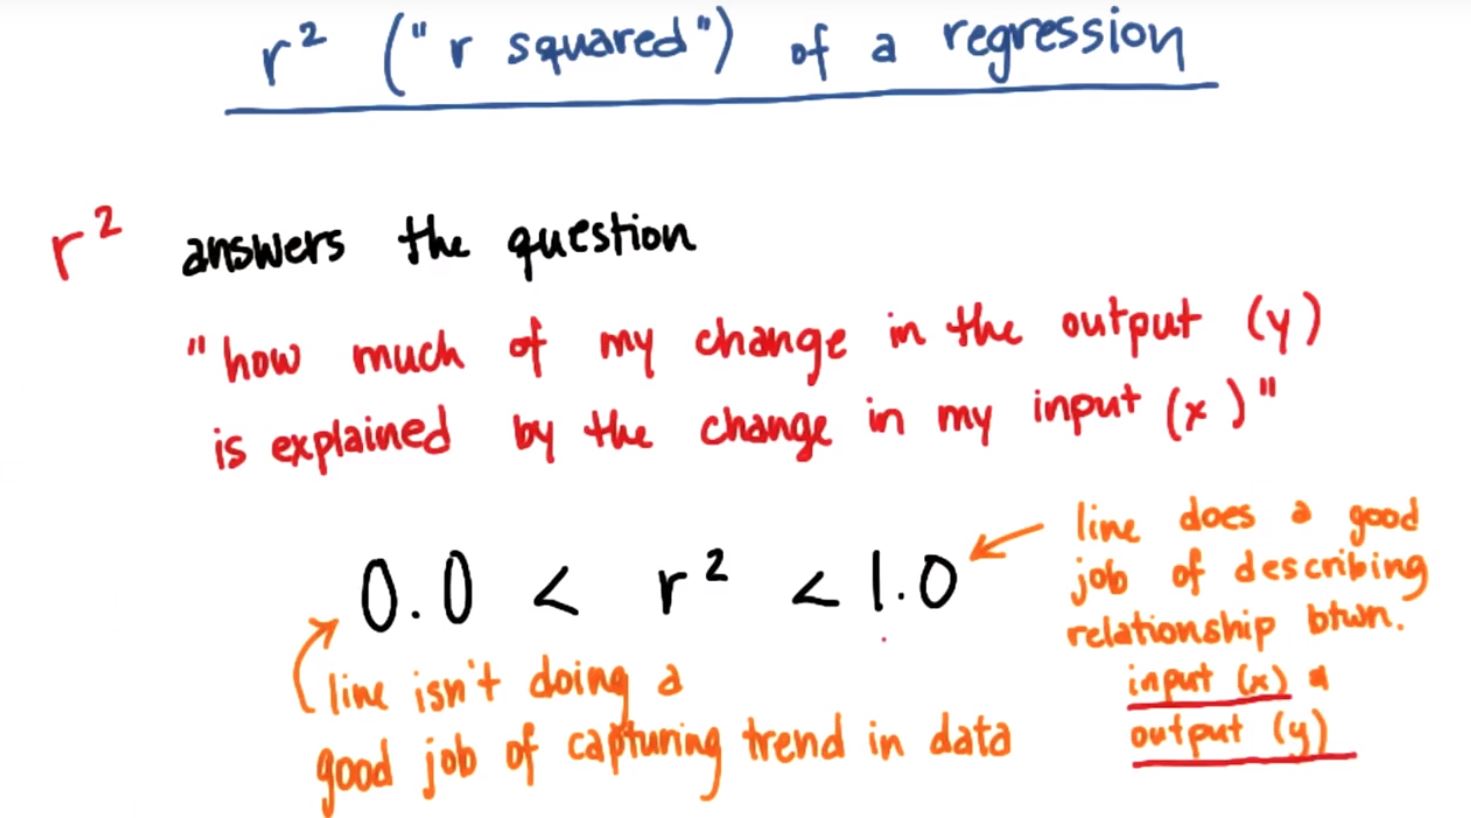
优点: 与训练点的数量无关
- Sklearn中的R平方
print "r-squared score:",reg.score(x,y)
R平方有可能小于0!
The coefficient R^2 is defined as (1 - u/v), where u is the regression sum of squares ((y_true - y_pred) ** 2).sum() and v is the residual sum of squares ((y_true - y_true.mean()) ** 2).sum(). Best possible score is 1.0 and it can be negative (because the model can be arbitrarily worse). A constant model that always predicts the expected value of y, disregarding the input features, would get a R^2 score of 0.0.
四、比较分类和回归
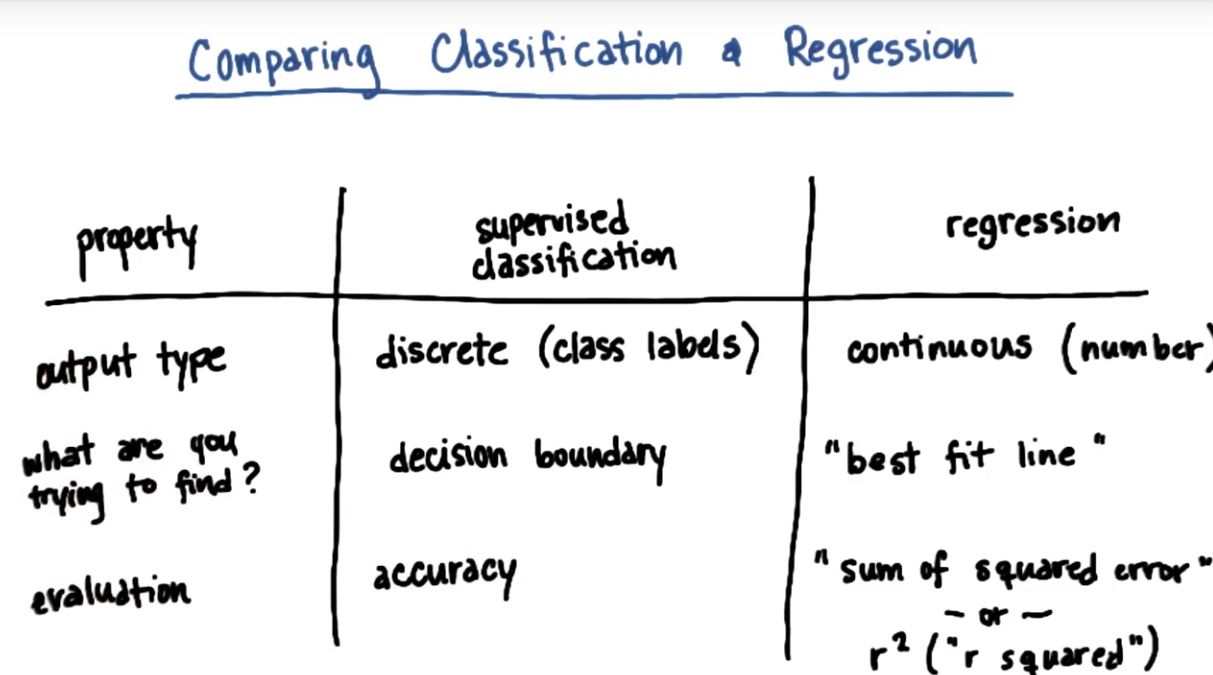
| 特性 | 监督分类 | 回归 |
|---|---|---|
| 输出类型 | 标签(离散) | 值(连续) |
| 寻找的结果(可视化) | 决策边界 | 最佳拟合曲线 |
| 评判模型的标准 | 准确度 | 误差平方和or R平方指标 |