项目源代码及数据:下载
1、项目要求
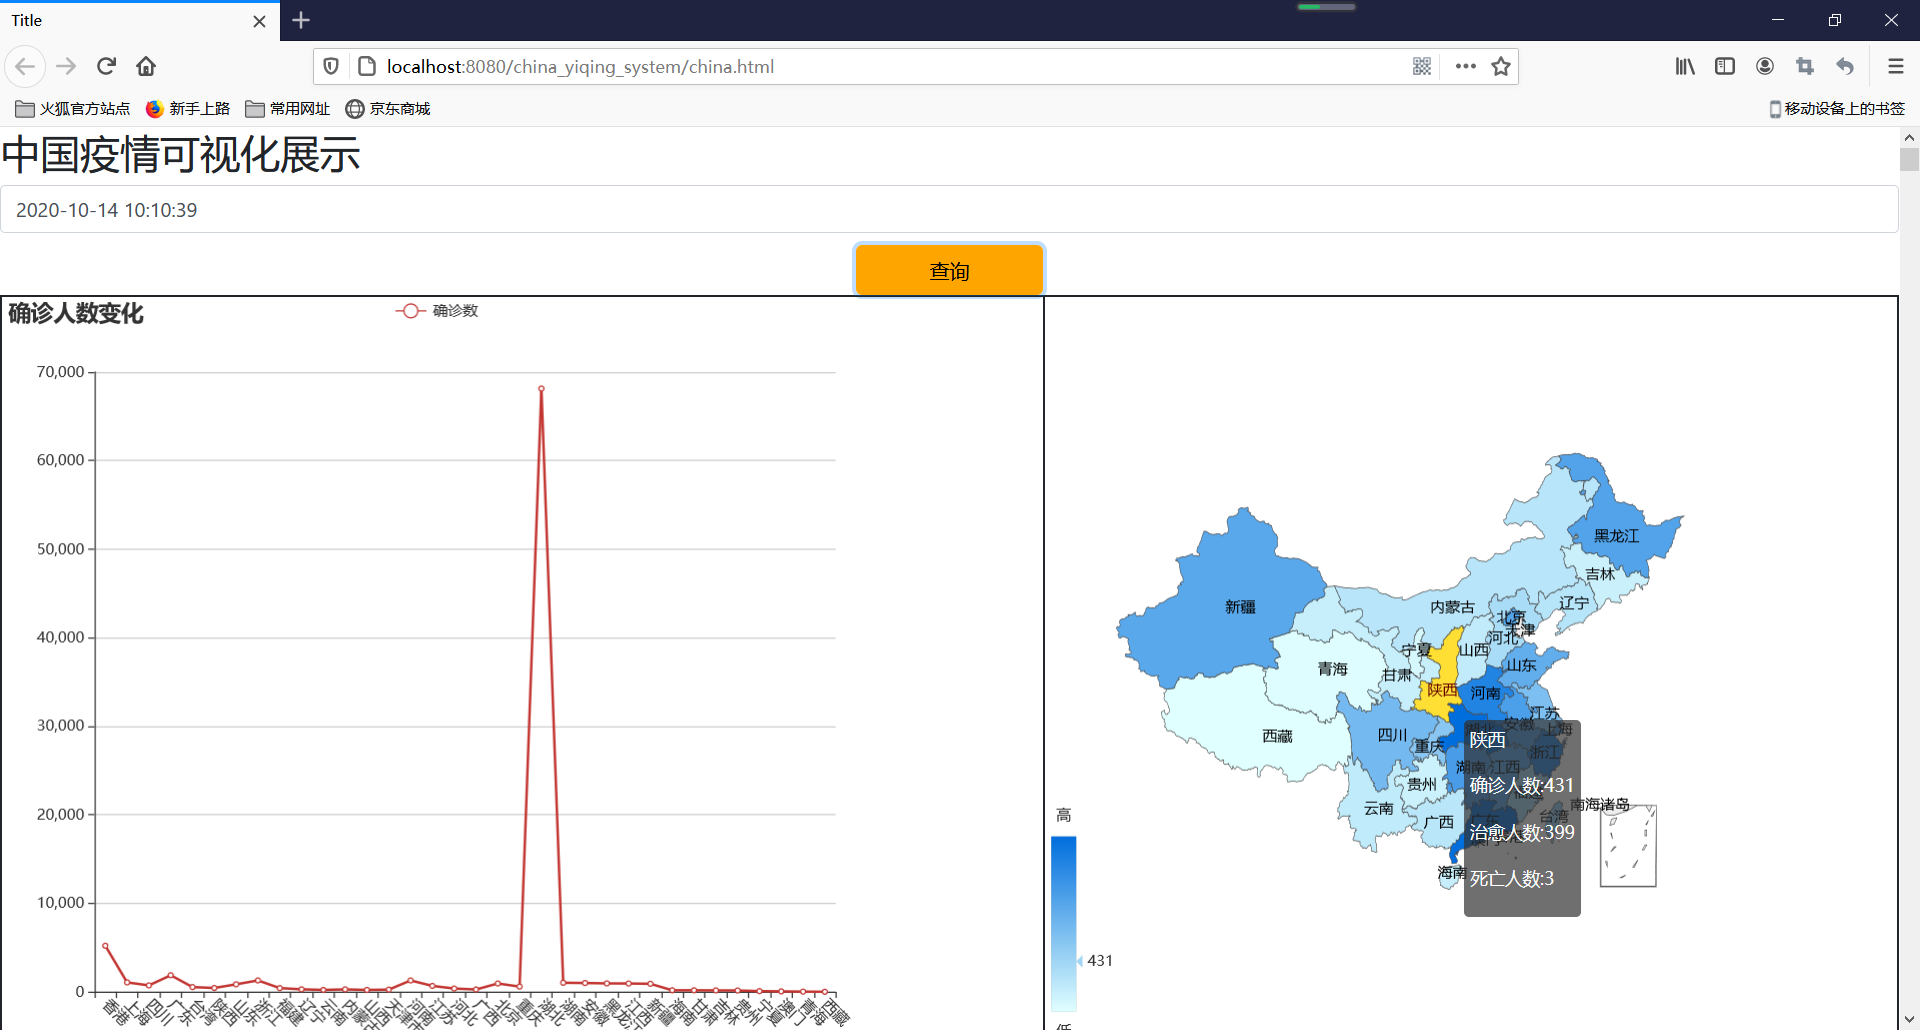
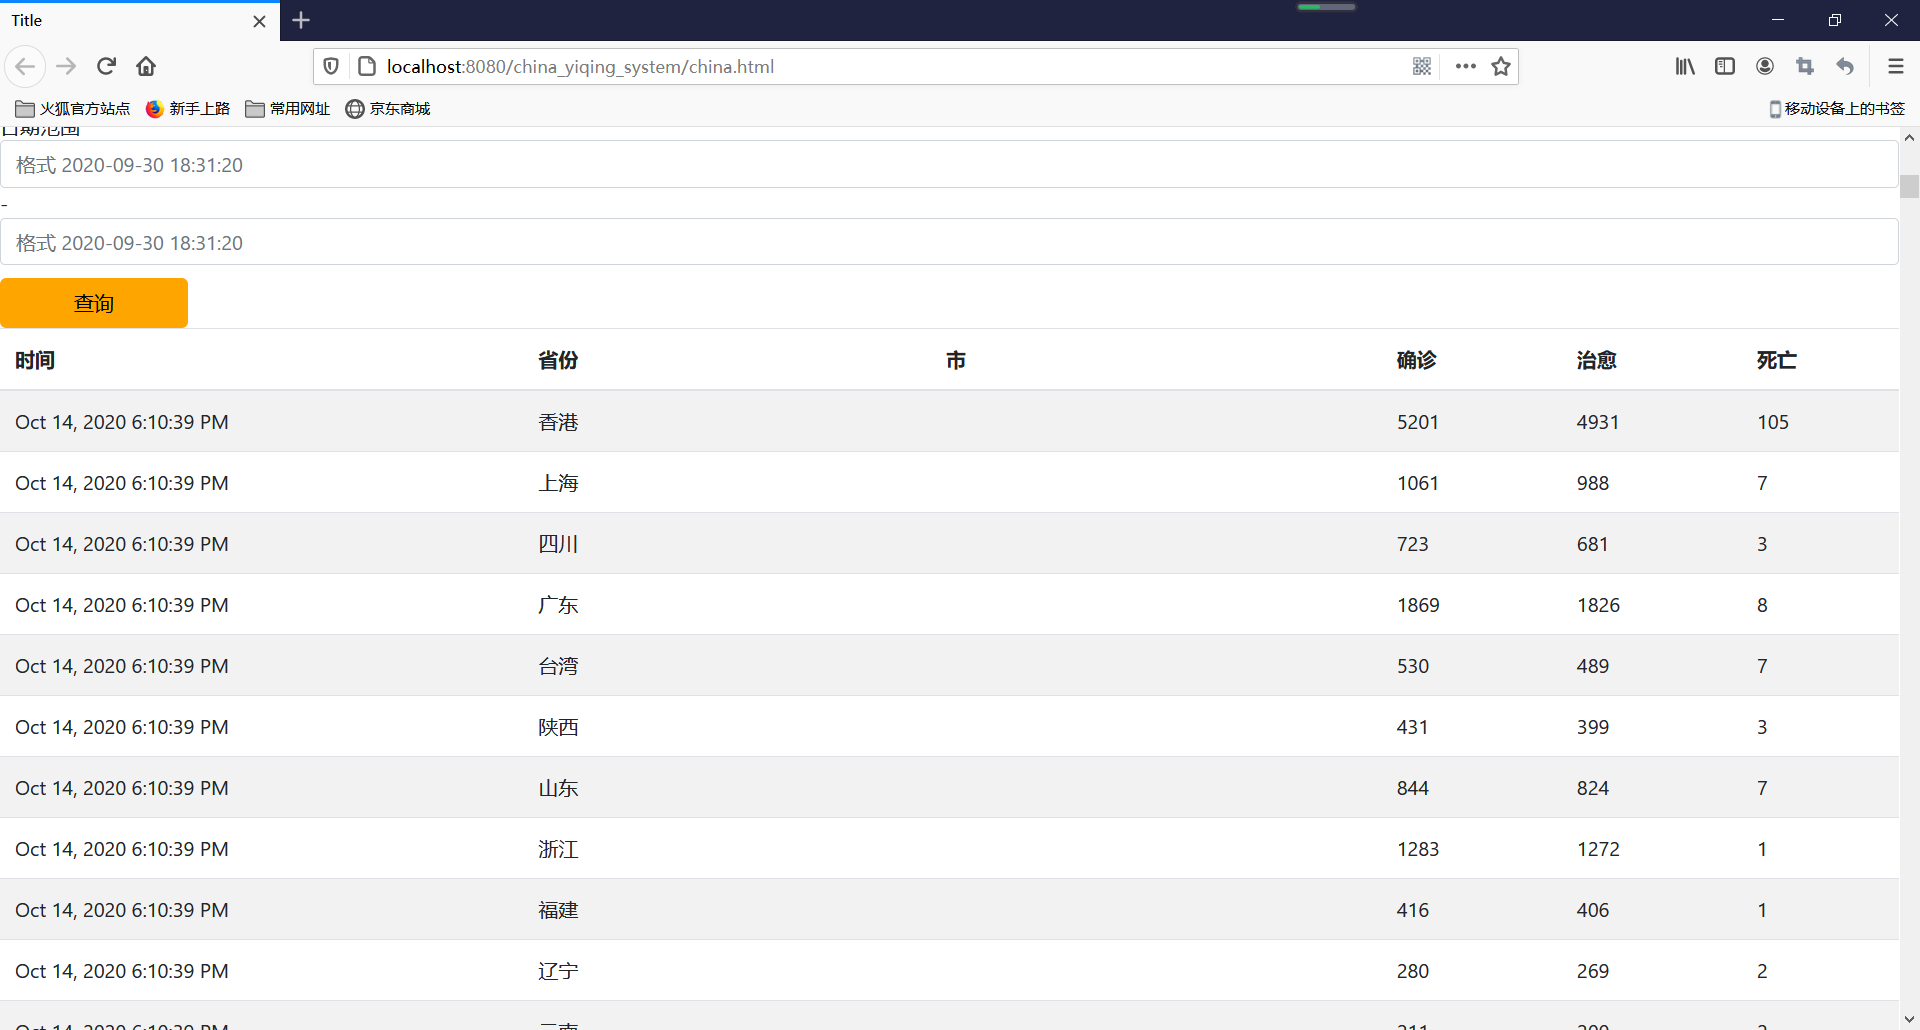
通过时间查询中国疫情数据以及疫情地图
2、开发工具
Eclipse+MySQL
3、项目结构

4、具体实现
4.1 导入相关jar包
4.2 前端代码
china.html
<!DOCTYPE html>
<html lang="en">
<head>
    <meta charset="UTF-8">
    <title>Title</title>
    <link rel="stylesheet" href="https://cdn.staticfile.org/twitter-bootstrap/4.3.1/css/bootstrap.min.css">
    <script src="https://cdn.staticfile.org/jquery/3.2.1/jquery.min.js"></script>
    <script src="https://cdn.staticfile.org/twitter-bootstrap/4.3.1/js/bootstrap.min.js"></script>
    <script src="js/echarts.min.js"></script>
    <script type="text/javascript" src="js/china.js" ></script>
    <script type="text/javascript" src="https://cdn.jsdelivr.net/npm/echarts/map/js/world.js?_v_=1598903772045"></script>

</head>
<style>
    .btnbag{
        width:100%;
        text-align:center;
    }
    .btn{
        width:150px;
        height:40px;
        border:0px;
        border-radius:5px;
        background-color:orange;
        color:black;
        margin-left:auto;
        margin-top:10px
    }
    #lines{
        /*background-color:#5c5c5c;*/
        border: solid 1px;
        height:600px;
    }
    #line{
        /*background-color:#5c5c5c;*/
        border: solid 1px;
        width:55%;
        height:600px;
        float: left;
    }
    #line2{
        /*background-color:#5c5c5c;*/
        border: solid 1px;
        width:45%;
        height:600px;
        float: left;
    }
</style>
<body>
<div id="title">
    <h2 >中国疫情可视化展示</h2>
</div>
<div><input type="text" class="form-control" id="time" placeholder="格式 2020-09-30 18:31:20"></div>
<div class="btnbag">
    <input type="button" class="btn" value="查询" onclick="findbytime()">
</div>
<div id="lines">
    <div id="line"></div>
    <div id="line2"></div>
</div>
<div id="getbydate"></div>
</body>
<script>
    $(function () {
        $.ajax({
            url:'getAll',
            dataType : "json",//数据格式
            type : "post",//请求方式
            async : false,//是否异步请求
            success : function(data)
            {  //如果请求成功,返回数据。
                //alert(data);
                var text="日期范围<input type='text' class='form-control' id='btime' name='btime' placeholder='格式 2020-09-30 18:31:20'>-" +
                    "<input type='text' class='form-control' id='etime' name='etime' placeholder='格式 2020-09-30 18:31:20'>" +
                    "<input type='button' class='btn' value='查询' onclick='findbybetime()'>";
                text+="<table class='table table-striped'><thead><tr>" +
                    "<th>时间</th><th>省份</th><th>市</th><th>确诊</th><th>治愈</th><th>死亡</th></tr></thead><tbody>";
                for(i=0;i<data.length;i++)
                {
                    text+="<tr>";
                    var cityName="";
                    if (data[i].cityName==null){
                        cityName="";
                    }else {
                        cityName=data[i].cityName;
                    }

                    text+="<td>"+data[i].time+"</td>" +
                        "<td>"+data[i].provinceName+"</td>" +
                        "<td>"+cityName+"</td>" +
                        "<td>"+data[i].confirmedCount+"</td>" +
                        "<td>"+data[i].curedCount+"</td>" +
                        "<td>"+data[i].deadCount+"</td>" +
                        "</tr>";
                }
                text+="</table>";
                $("#getbydate").html(text);
            },
            error:function (e) {
                alert("出错了!");
            }
        });
    })

    function findbybetime() {
        var btime=$("#btime").val();
        var etime=$("#etime").val();
        //alert(btime+etime);
        $.ajax({
            url:'getByBETime',
            dataType : "json",//数据格式
            type : "post",//请求方式
            async : false,//是否异步请求
            data:{
                "btime" : btime,
                "etime" : etime
            },
            success : function(data)
            {  //如果请求成功,返回数据。
                //alert(data);
                var text="日期范围<input type='text' class='form-control' id='btime' name='btime' placeholder='格式 2020-09-30 18:31:20'>-" +
                    "<input type='text' class='form-control' id='etime' name='etime' placeholder='格式 2020-09-30 18:31:20'>" +
                    "<input type='button' class='btn' value='查询' onclick='findbybetime()'>";
                text+="<table class='table table-striped'><thead><tr>" +
                    "<th>时间</th><th>省份</th><th>市</th><th>确诊</th><th>治愈</th><th>死亡</th></tr></thead><tbody>";
                for(i=0;i<data.length;i++)
                {
                    text+="<tr>";
                    var cityName="";
                    if (data[i].cityName==null){
                        cityName="";
                    }else {
                        cityName=data[i].cityName;
                    }

                    text+="<td>"+data[i].time+"</td>" +
                        "<td>"+data[i].provinceName+"</td>" +
                        "<td>"+cityName+"</td>" +
                        "<td>"+data[i].confirmedCount+"</td>" +
                        "<td>"+data[i].curedCount+"</td>" +
                        "<td>"+data[i].deadCount+"</td>" +
                        "</tr>";
                }
                text+="</table>";
                $("#getbydate").html(text);
            },
            error:function (e) {
                alert("出错了!");
            }
        });
    }

    function findbytime() {
        var time=$("#time").val();
        //alert(time);
        var myChart1 = echarts.init(document.getElementById('line'));
        myChart1.setOption({
            title:{
                text:'确诊人数变化'
            },

            tooltip:{},
            grid: {
                left: '4%',
                right: '4%',
                bottom: '3%',
                //是否显示刻度标签
                containLabel: true
            },
            legend:{
                data:['确诊数']
            },
            xAxis:{
                data:[],
                axisLabel:{
                    //横坐标全部显示
                    interval:0,
                    //横坐标倾斜45度
                    rotate:-45,
                },
            },
            yAxis:{},
            series:[{
                name:'确诊数',
                type:'line',
                data:[]
            }]
        })
        var pname=[];
        var value=[];
        //处理这段时间疫情总数变化趋势
        $.ajax({
            url:"findByTime",
            type:"POST",
            dataType:"JSON",
            async:true,data:{
                "time" : time,
            },
            success:function(data){
                //alert(data);
                for(var i=0;i<data.length;i++)
                {
                    pname[i]=data[i].provinceName;
                    value[i]=parseInt(data[i].confirmedCount);
                }
                //alert(pname);
                //alert(value);
                myChart1.setOption({
                    xAxis:{
                        //放横坐标的数组
                        data:pname,
                    },
                    series:[{
                        name:'确诊数',
                        //每个横坐标对应的数值
                        data:value
                    }]
                });
            }
        });

        //处理地图
        $.ajax({
            url:"findByTime",
            type:"POST",
            dataType:"JSON",
            async:true,data:{
                "time" : time,
            },
            success:function(result){
                mydata = new Array();
                for(var i=0;i<result.length;i++){
                    mydata.push({
                        value: result[i].confirmedCount,
                        name: result[i].provinceName,
                    })
                }

                var myChart2 = echarts.init(document.getElementById('line2'));
                var option1={
                    title : {
                        text: '',
                        subtext: '',
                        x:'center'
                    },
                    tooltip : {
                        formatter : function(params){
                            index=params.dataIndex;
                            tip="<p>"+params.name+"</p><p>确诊人数:"+result[index].confirmedCount+"</p><p>治愈人数:"+result[index].curedCount+"</p><p>死亡人数:"+result[index].deadCount+"</p>";
                            return tip;
                        }
                    },
                    //左侧小导航图标
                    visualMap: {
                        min: 0,
                        max: 1500,
                        left: 'left',
                        top: 'bottom',
                        text: ['高','低'],
                        inRange: {
                            color: ['#e0ffff', '#006edd']
                        },
                        show:true
                    },
                    //配置属性
                    series: [{
                        name : '疫情统计',
                        type: 'map',
                        mapType: 'china',
                        data: mydata,
                        roam : false,
                        itemStyle:{
                            normal:{label:{show:true}},
                            emphasis:{label:{show:true}}
                        },
                    }]
                };
                myChart2.setOption(option1);
            }
        });
    }
</script>

</html>
4.3 后端代码
下载源代码查看
5、结果展示