#使用数据:UFO数据
#读入数据,该文件以制表符分隔,因此使用read.delim,参数sep设置分隔符为
#所有的read函数都把string读成factor类型,这个类型用于表示分类变量,因此将stringsAsFactors设置为False
#header=F表示文件中并没有表头
#na.string='',表示把空元素设置为R中的特殊值NA,即将所有空元素读成NA
ufo<-read.delim('ufo_awesome.tsv',sep=' ',stringsAsFactors=F,header=F,na.string='')
#head(data):查看数据前6行
#tail(data):查看数据后6行
head(ufo)

#添加表头
names(ufo) <- c("DateOccurred", "DateReported","Location", "ShortDescription","Duration","LongDescription")
#由上图看出日期格式为YYYYMMDD,将其转换为R语言中的日期格式
ufo$DateOccurred<-as.Date(ufo$DateOccurred,format='%Y%M%D')
#错误于strptime(x, format, tz = "GMT") : 输入字符串太长,原因是有些日期字符串大于8个字符,因此需要进行处理
#用以下代码查看日期长度不为8的
#nchar函数表示得出字符串长度
head(ufo[which(nchar(ufo$DateOccurred)!=8|nchar(ufo$DateReported)!=8),1])

good.rows <- ifelse(nchar(ufo$DateOccurred) != 8 | nchar(ufo$DateReported) != 8,FALSE,TRUE)
length(which(!good.rows))
#结果有731条记录(中文书是371条,应该是写错了)的日期不是8个字符,可以直接从数据集中删去
ufo <- ufo[good.rows, ]
#接着将所有日期字符串转为R语言中的日期型
ufo$DateOccurred <- as.Date(ufo$DateOccurred, format = "%Y%m%d")
ufo$DateReported <- as.Date(ufo$DateReported, format = "%Y%m%d")
#接下来要清理目击地点数据,原有数据是City,State,将其拆分为两列
#定义一个函数,如果格式不正确返回NA,NA,如果正确返回city state列表
#gsub函数用于替换
get.location <- function(l)
{
split.location <- tryCatch(strsplit(l, ",")[[1]],
error = function(e) return(c(NA, NA)))
clean.location <- gsub("^ ","",split.location)
if (length(clean.location) > 2)
{
return(c(NA,NA))
}
else
{
return(clean.location)
}
}
#接着用lapply函数对ufo的Location每一个记录都采用get.location函数进行处理,结果保存到city.state
city.state <- lapply(ufo$Location, get.location)

#要把城市和州信息作为不同的两列加入数据框中,需要将LIST转为Matrix
#do.call函数表示对city.state的每一条记录都按行合并转换为matrix
location.matrix <- do.call(rbind, city.state)

#用transform函数为ufo添加了两个列
ufo <- transform(ufo,USCity = location.matrix[, 1],USState = location.matrix[, 2],stringsAsFactors = FALSE)
#state.abb是美国州的大写,将不是美国州名的全部转为NA
ufo$USState <- state.abb[match(ufo$USState, state.abb)]
#只保留美国州名的地点的记录,将记录存入ufo.us
ufo.us <- subset(ufo, !is.na(USState))
#观察一下目击时间,从1400年到2010年
summary(ufo.us$DateOccurred)
#画一下直方图看看目击时间分布
quick.hist <- ggplot(ufo.us, aes(x = DateOccurred)) +geom_histogram() + scale_x_date(breaks = "50 years")
print(quick.hist)
#如下图,发现大部分都发生在1960-2010年,我们只关注1990-2010数据

#只取1990年后的数据
ufo.us <- subset(ufo.us, DateOccurred >= as.Date("1990-01-01"))
#再画一次直方图

#我们的目的是发现目击事件的周期性规律,应该按一定周期进行聚合,比如按月聚合,因此需要统计每州每年月的UFO目击次数
#以下代码给ufo.us增加一个新的列是YearMonth,其中提取出目击时间的年和月,strftime是将字符串转成日期型
ufo.us$YearMonth <- strftime(ufo.us$DateOccurred, format = "%Y-%m")
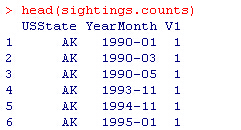
#使用ddply函数,对ufo.us,按USState和YearMonth进行聚合
sightings.counts <- ddply(ufo.us, .(USState,YearMonth), nrow)
#没有1990年2月和4月,因此需要把目击次数为0的月份也加进去
#先建一个包括所有月份的时间序列数据到date.range
date.range <- seq.Date(from = as.Date(min(ufo.us$DateOccurred)),to = as.Date(max(ufo.us$DateOccurred)),by = "month")
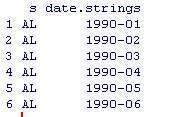
#然后转为年-月的格式到date.strings
date.strings <- strftime(date.range, "%Y-%m")
#接着需要建一个包含所有年月和州的数据框
states.dates <- lapply(state.abb, function(s) cbind(s, date.strings))
states.dates <- data.frame(do.call(rbind, states.dates),stringsAsFactors = FALSE)
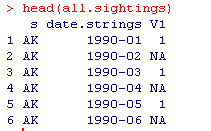
#合并数据all = TRUE表示没匹配的也要包含进来并且设为NA
all.sightings <- merge(states.dates,sightings.counts,by.x = c("s", "date.strings"),by.y = c("USState", "YearMonth"),all = TRUE)
names(all.sightings) <- c("State", "YearMonth", "Sightings")
#将为NA的全部设为0
all.sightings$Sightings[is.na(all.sightings$Sightings)] <- 0
#将date.strings转为日期型
all.sightings$YearMonth <- as.Date(rep(date.range, length(state.abb)))
#将州名转换为分类变量
all.sightings$State <- as.factor(all.sightings$State)
#画图,geom_line表示曲线图,facet_wrap表示按State分类变量,每个因子画一个图,因为有50个州,规定10行5列.
#theme_bw表示用白色背景和黑色网格线画图
state.plot <- ggplot(all.sightings, aes(x = YearMonth,y = Sightings)) +
geom_line(aes(color = "darkblue")) +
facet_wrap(~State, nrow = 10, ncol = 5) +
theme_bw() +
scale_color_manual(values = c("darkblue" = "darkblue"), guide = "none") +
scale_x_date(breaks = "5 years") +
xlab("Years") +
ylab("Number of Sightings") +
ggtitle("Number of UFO sightings by Month-Year and U.S. State (1990-2010)")
