1 plot()函数
画一条线
plot(X,Y)
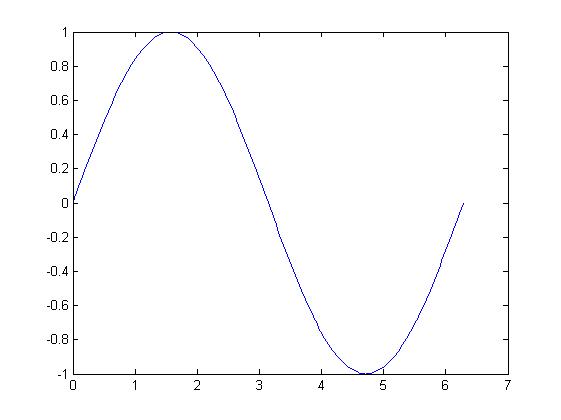
最基本的例子
x = 0: pi / 100:2 * pi;
y = sin(x);
figure
plot(x,y)
在一张图上画多条线
clc;
clear;
x = linspace(-2 * pi,2 * pi);
y1 = sin(x);
y2 = cos(x);
figure
plot(x,y1,x,y2)

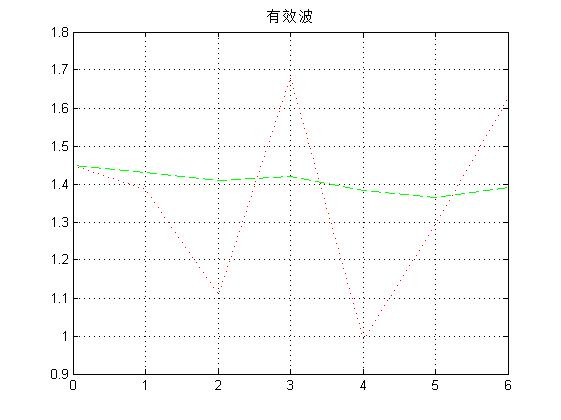
2 Matlab绘制两个图
Matlab可以使用figure(1), figure(2)作多幅图
clc;
clear;
buoy_effective_wave = [1.45
1.43
1.41
1.42
1.382
1.364
1.39
];
radar_effective_wave = [1.44846
1.38654
1.1079
1.68066
0.9918
1.29366
1.62648
];
figure(1);
x = 0 : 6;
plot(x,buoy_effective_wave,'g--',x,radar_effective_wave,'r:');
title('有效波');
grid on;
buoy_wave_crest_week=[36.69
36.21
37.32
36.79
36.773
36.091
37.03];
radar_wave_crest_week=[35.8
33
46.5
38.7
36.6
30.2
39.5];
figure(2);
x = 0 : 6;
plot(x,buoy_wave_crest_week,'g--',x,radar_wave_crest_week,'r:');
title('波峰周');
grid on;
buoy_wave_crest=[111.268
110.972
112.153
112.484
110.495
112.951
117.189
];
radar_wave_crest=[88.48
68.35
102.16
85.16
90.62
103.49
91.32
];
figure(3);
x = 0 : 6;
plot(x,buoy_wave_crest,'g--',x,radar_wave_crest,'r:');
title('波峰峰');
grid on;