1.导入 world.china.js 这个js是将world.js 文件 以及china.js文件进行合并 (网上一些中国地图勾勒的身份曲线感觉很飘 所以自己加工了一下china.js中的数据, 然后合并到了word.js中)
(可以在这里进行下载 https://github.com/a1115040996/MyHTML/blob/master/world-china.js)
2.现在echarts.js源码
3.生成地图
<!DOCTYPE html>
<html>
	<head>
		<meta charset="UTF-8">
		<title></title>
	</head>
	<body>
		<div id="box" style=" 1000px;height: 1000px;"></div>
		<script src="js/echarts.js" type="text/javascript" charset="utf-8"></script>
		<script src="js/world-china.js" type="text/javascript" charset="utf-8"></script>
		<script type="text/javascript">
			var myCharts = echarts.init(document.getElementById('box'));
			myCharts.setOption({
				visualMap: {
			        min: 0,
			        max: 1000000,
			        text:['High','Low'],
			        realtime: false,
			        calculable: true,
			        color: ['orangered','yellow','lightskyblue']
			    },
				 series: [{
			        name: 'chinaMap',
			        type: 'map',
			        map: 'world',
			        roam: true,
			        itemStyle:{
		                emphasis:{label:{show:true}}
		            },
		            center: [115.97, 29.71],
		            zoom: 12,
			        label: {
			            normal: {
			                show: true,
			                position: 'center',
			                formatter: '{b}'
			            }
			        },
			        data: [
			        	{name: '山东省', value: '1000'}
			        ],
			        zlevel: 3
			    }]
			});
		</script>
	</body>
</html>
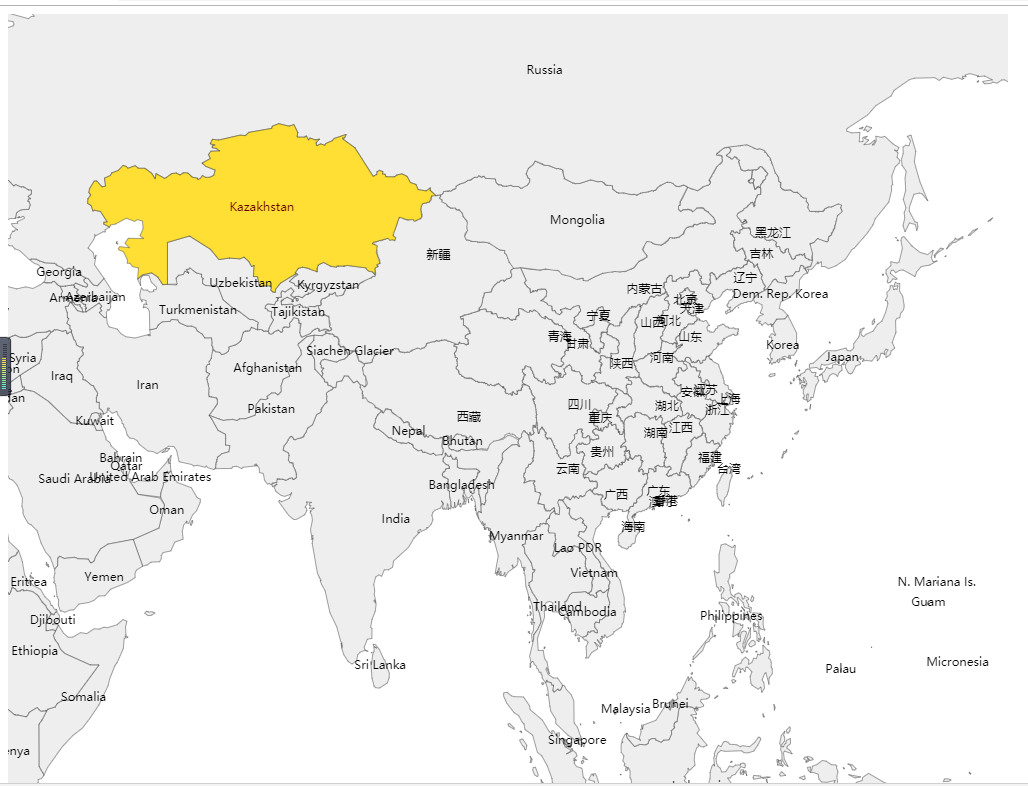
预览图