ELK + Filebeat 日志分析系统
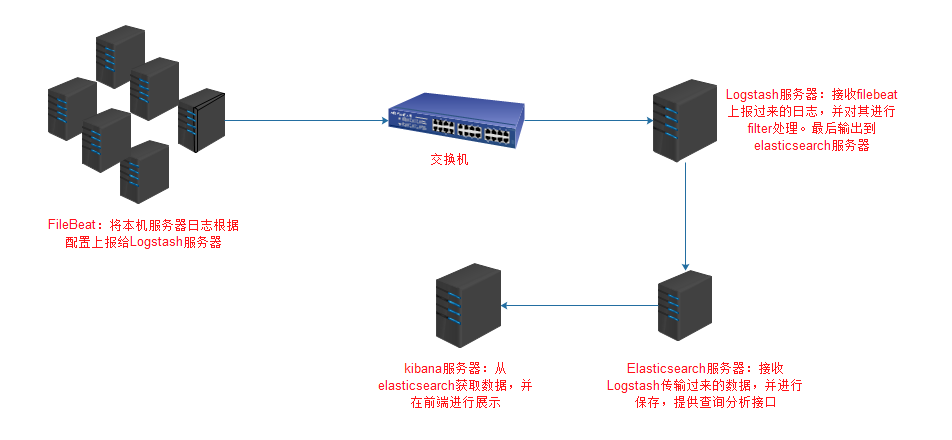
架构图
环境
OS:CentOS 7.4
Filebeat: 6.3.2
Logstash: 6.3.2
Elasticsearch 6.3.2
Kibana: 6.3.2
FileBeat安装配置
安装
wget https://artifacts.elastic.co/downloads/beats/filebeat/filebeat-6.3.2-x86_64.rpm
yum localinstall filebeat-6.3.2-x86_64.rpm
配置
这里以nginx日志为例作为演示
配置文件:/etc/filebeat/filebeat.yml
filebeat.prospectors:
- input_type: log  #输入类型为log
  paths:  #日志路径
    - /usr/local/nginx/logs/*.access.log
  document_type: ngx-access-log  #日志类型
- input_type: log
  paths:
    - /usr/local/nginx/logs/*.error.log
  document_type: ngx-error-log
output.logstash:  #输出到Logstash(也可以输出到其他,如elasticsearch)
  hosts: ["10.1.4.171:1007"]
启动
systemctl enable filebeat
systemctl start filebeat
Logstash安装配置
安装
wget https://artifacts.elastic.co/downloads/logstash/logstash-6.3.2.rpm
yum localinstall logstash-6.3.2.rpm
配置
Logstash需要自定义,自定义配置文件目录是/etc/logstash/conf.d
这里新建一个filebeat.conf配置文件
/etc/logstash/conf.d/filebeat.conf
input {
    #输入方式是beats
    beats {
        port => "1007"  #监听1007端口(自定义端口)
    }
}

filter {
    if [type] == "ngx-access-log" { #对日志类型为ngx-access-log进行处理。日志类型为filebeat配置定义
        grok {
            patterns_dir => "/usr/local/logstash/patterns"
            match => {  #对传过来的message字段做拆分,分割成多个易读字段
                message => "%{IPV4:remote_addr}|%{IPV4:FormaxRealIP}|%{POSINT:server_port}|%{GREEDYDATA:scheme}|%{IPORHOST:http_host}|%{HTTPDATE:time_local}|%{HTTPMETHOD:request_method}|%{URIPATHPARAM:request_uri}|%{GREEDYDATA:server_protocol}|%{NUMBER:status}|%{NUMBER:body_bytes_sent}|%{GREEDYDATA:http_referer}|%{GREEDYDATA:user_agent}|%{GREEDYDATA:http_x_forwarded_for}|%{HOSTPORT:upstream_addr}|%{BASE16FLOAT:upstream_response_time}|%{BASE16FLOAT:request_time}|%{GREEDYDATA:cookie_formax_preview}"
            }
            remove_field => ["message"]   #已经将message字段拆分,可以将message字段删除
        }

        date {
            match => [ "time_local", "dd/MMM/yyyy:HH:mm:ss Z"]    #nginx日志中的时间替换@timestamp
            remove_field => ["time_local"]   #删除nginx日志时间字段
        }

        mutate {
            rename => ["http_host", "host"]   #nginx日志中http_host字段,替换host字段
        }
    }
}

output {
    elasticsearch {   # 输出到elasticsearch
        hosts => ["127.0.0.1:9200"]
        index => "logstash-%{type}-%{+YYYY.MM.dd}"   #输出索引格式
    }
}
启动
systemctl enable logstash
systemctl start logstash
Elasticsearch安装配置
安装
wget https://artifacts.elastic.co/downloads/elasticsearch/elasticsearch-6.3.2.rpm
yum localinstall elasticsearch-6.3.2.rpm
配置
/etc/elasticsearch/elasticsearch.yml
path.data: /var/lib/elasticsearch
path.logs: /var/log/elasticsearch
network.host: 0.0.0.0
http.port: 9200
#elasticsearch-head需要下列配置
http.cors.enabled: true
http.cors.allow-origin: "*"
启动
systemctl enable elasticsearch
systemctl start elasticsearch
elasticsearch-head安装
elasticsearch-head用于连接elasticsearch,并提供一个前端管理页面
git clone git://github.com/mobz/elasticsearch-head.git
cd elasticsearch-head
npm install
npm run start
open http://localhost:9100/
Kibana安装配置
安装
wget https://artifacts.elastic.co/downloads/kibana/kibana-6.3.2-x86_64.rpm
yum localinstall kibana-6.3.2-x86_64.rpm
配置
默认配置就好
启动
nohup /usr/share/kibana/bin/kibana &> /usr/share/kibana/logs/kibana.stdout &
nginx代理到kibana
安装nginx
yum install nginx
配置
/etc/nginx/conf.d/kibana.conf
server {
    listen 80;
    server_name test.kibana.com;

    root html;
    access_log  /var/log/nginx/test.kibana.com.access.log main;
    error_log   /var/log/nginx/test.kibana.com.error.log;

    proxy_next_upstream http_502 http_504 error timeout invalid_header;
    proxy_connect_timeout     10;
    proxy_read_timeout        30;
    proxy_send_timeout        180;
    proxy_ignore_client_abort on;
    proxy_set_header X-Forwarded-For $proxy_add_x_forwarded_for;
    proxy_buffering           off;
    proxy_set_header Host $host;

    location /monitor {
        default_type text/plain;
        return 200 "OK";
    }

    location /echoip {
       default_type text/plain;
       return 200 $http_x_forwarded_for,$remote_addr;
    }

    location / {
        expires off;
        if ($server_port = "80") {
            proxy_pass http://127.0.0.1:5601;
        }
        proxy_pass  https://127.0.0.1:5601;

    }
}
启动
systemctl enable nginx
systemctl start nginx
后记
本文只是简单介绍了一下ELK+Filebeat日志分析系统的安装配置,以及一个简单的nginx日志处理过程。要想更细致的学习ELK体系,可以看ELKstack 中文指南。虽然该书以ELK5版本进行讲解,ELK6也可以看。