一、二维的插值方法:
- 原始数据(x,y)
- 先对横坐标x进行扩充数据量,采用linspace。【如下面例子,由7个值扩充到300个】
- 采用scipy.interpolate中的spline来对纵坐标数据y进行插值【也由7个扩充到300个】。
- 画图
import matplotlib.pyplot as plt import numpy as np
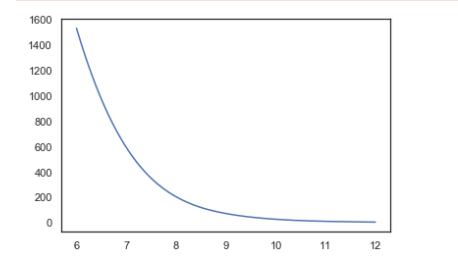
#数据 T = np.array([6, 7, 8, 9, 10, 11, 12]) power = np.array([1.53E+03, 5.92E+02, 2.04E+02, 7.24E+01, 2.72E+01, 1.10E+01, 4.70E+00])
#插值 from scipy.interpolate import spline xnew = np.linspace(T.min(),T.max(),300) #300 represents number of points to make between T.min and T.max power_smooth = spline(T,power,xnew) print(xnew.shape) #(300,) print(power_smooth.shape) #(300,)
#画图 plt.plot(xnew,power_smooth) plt.show()
二、三维平滑图---插值:
1、数据:
x = [0.1,0.2,……,0.9] (shape = (9))
y = [0.1,0.2,……,0.9] (shape = (9))
z = 【81个数据】(shape = (81))
生成数据:


x = np.linspace(0.1,0.9,9)
y = np.linspace(0.1,0.9,9)
z = np.random.rand(81)
2、将x和y进行扩充到想要的大小:
【两种方法:np.arange和np.linspace】
xnew = np.arange(0.1, 1, 0.03) 【shape=(31)】
ynew = np.arange(0.1, 1, 0.03) 【shape=(31)】
或者
xnew = np.linspace(0.1, 0.9, 31)
ynew = np.linspace(0.1, 0.9, 31)
3、对z进行插值:
采用 scipy.interpolate.interp2d函数进行插值。
x,y原数据:【x.shape=9,y.shape=9,z.shape=81】
f = interpolate.interp2d(x, y, z, kind='cubic')
x,y扩充数据:【xnew.shape=31,y.shape=31】
znew = f(xnew, ynew) 【得到的znew.shape = (31,31)】
znew为插值后的z
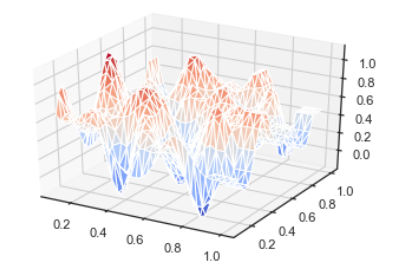
4、画图:
采用 from mpl_toolkits.mplot3d import Axes3D进行画三维图
Axes3D简单用法:
import matplotlib.pyplot as plt
from mpl_toolkits.mplot3d import Axes3D
fig = plt.figure()
ax = fig.add_subplot(111, projection='3d')
比如采用plot_trisurf画三维图:plot_trisurf(x,y,z)
【plot_trisurf对数据要求是:x.shape = y.shape = z.shape,所以x和y的shape需要修改,采用np.meshgrid,且都为一维数据】
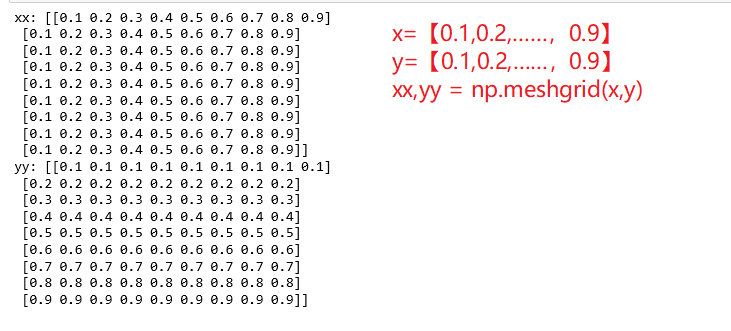
#修改x,y,z输入画图函数前的shape
xx1, yy1 = np.meshgrid(xnew, ynew)

newshape = (xx1.shape[0])*(xx1.shape[0])
y_input = xx1.reshape(newshape)
x_input = yy1.reshape(newshape)
z_input = znew.reshape(newshape)
5、所有代码:
# 载入模块
import numpy as np
import matplotlib.pyplot as plt
from mpl_toolkits.mplot3d import Axes3D
from matplotlib import cm
import pandas as pd
import seaborn as sns
from scipy import interpolate

#生成数据
x = np.linspace(0.1,0.9,9)
y = np.linspace(0.1,0.9,9)
z = np.random.rand(81)

#插值
# xx, yy = np.meshgrid(x, y)

f = interpolate.interp2d(x, y, z, kind='cubic')
xnew = np.arange(0.1, 1, 0.03)
ynew = np.arange(0.1, 1, 0.03)
znew = f(xnew, ynew)

#修改x,y,z输入画图函数前的shape
xx1, yy1 = np.meshgrid(xnew, ynew)
newshape = (xx1.shape[0])*(xx1.shape[0])
y_input = xx1.reshape(newshape)
x_input = yy1.reshape(newshape)
z_input = znew.reshape(newshape)

#画图
sns.set(style='white')
fig = plt.figure()
ax = fig.add_subplot(111, projection='3d')
ax.plot_trisurf(x_input,y_input,z_input,cmap=cm.coolwarm)
plt.show()