Python第三方库之openpyxl(12)
地面天气图
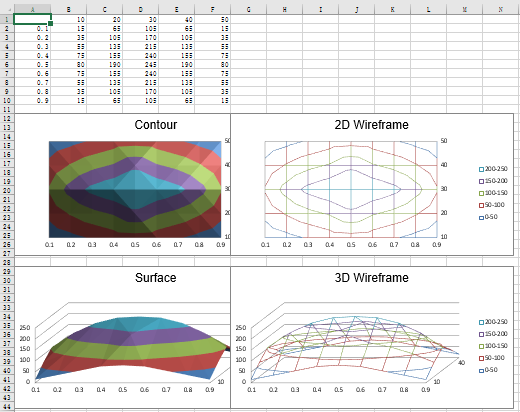
在工作表上的列或行中安排的数据可以在一个表中绘制。当您想要在两组数据之间找到最佳组合时,一个表面图表是有用的。正如在地形图中一样,颜色和图案表示的区域是相同的值域。默认情况下,所有的表面图都是3D的。通过设置rotation 和perspective来创建2D线框和轮廓图。


from openpyxl import Workbook
from openpyxl.chart import (
    SurfaceChart,
    SurfaceChart3D,
    Reference,
    Series,
)
from openpyxl.chart.axis import SeriesAxis

wb = Workbook()
ws = wb.active

data = [
    [None, 10, 20, 30, 40, 50,],
    [0.1, 15, 65, 105, 65, 15,],
    [0.2, 35, 105, 170, 105, 35,],
    [0.3, 55, 135, 215, 135, 55,],
    [0.4, 75, 155, 240, 155, 75,],
    [0.5, 80, 190, 245, 190, 80,],
    [0.6, 75, 155, 240, 155, 75,],
    [0.7, 55, 135, 215, 135, 55,],
    [0.8, 35, 105, 170, 105, 35,],
    [0.9, 15, 65, 105, 65, 15],
]

for row in data:
    ws.append(row)


c1 = SurfaceChart()
ref = Reference(ws, min_col=2, max_col=6, min_row=1, max_row=10)
labels = Reference(ws, min_col=1, min_row=2, max_row=10)
c1.add_data(ref, titles_from_data=True)
c1.set_categories(labels)
c1.title = "Contour"

ws.add_chart(c1, "A12")

from copy import deepcopy

# wireframe
c2 = deepcopy(c1)
c2.wireframe = True
c2.title = "2D Wireframe"

ws.add_chart(c2, "G12")

# 3D Surface
c3 = SurfaceChart3D()
c3.add_data(ref, titles_from_data=True)
c3.set_categories(labels)
c3.title = "Surface"

ws.add_chart(c3, "A29")

c4 = deepcopy(c3)
c4.wireframe = True
c4.title = "3D Wireframe"

ws.add_chart(c4, "G29")

wb.save("surface.xlsx")