一、安装matplotlib
利用pip安装,在命令行中输入
pip install matplotlib
pip就会自动下载matplotlib。下载完成后进入python的交互模式,输入
import matplotlib
如果没有出现错误信息,表明安装成功。
二、绘制折线图和散点图
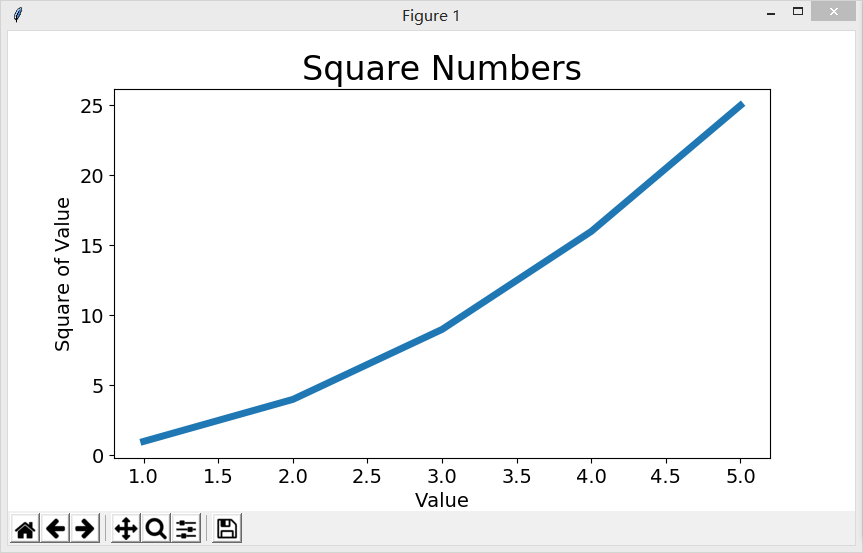
 1 import matplotlib.pyplot as plt
 2
 3 input_values=[1,2,3,4,5]
 4 squares=[1,4,9,16,25]
 5 plt.plot(input_values,squares,linewidth=5)
 6
 7 #set title and label
 8 plt.title('Square Numbers',fontsize=24)
 9 plt.xlabel('Value',fontsize=14)
10 plt.ylabel('Square of Value',fontsize=14)
11
12 #scale size
13 plt.tick_params(axis='both',labelsize=14)
14 plt.show()
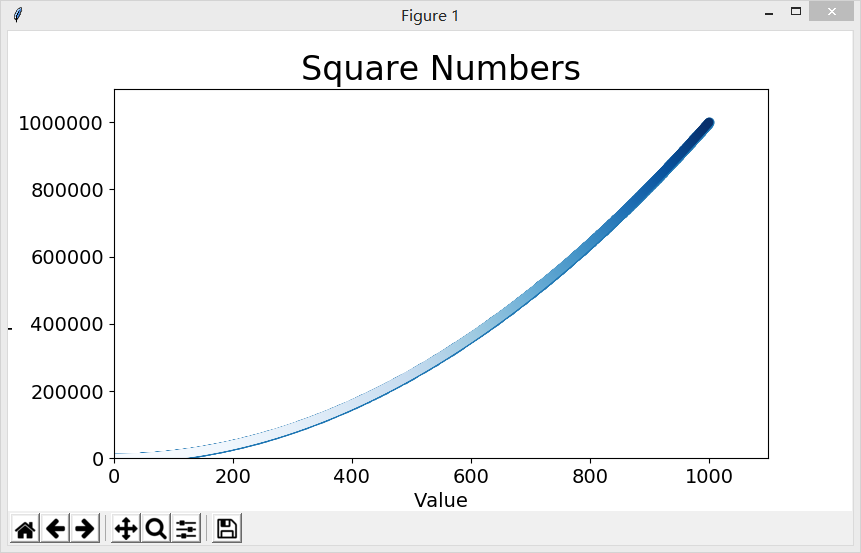
绘制散点图,并让点的颜色渐变
import matplotlib.pyplot as plt

x_values=list(range(1,1001))
y_values=[x**2 for x in x_values]

plt.scatter(x_values,y_values,s=40)
#set title and label
plt.title('Square Numbers',fontsize=24)
plt.xlabel('Value',fontsize=14)
plt.ylabel('Square of value',fontsize=14)

#set scale
plt.tick_params(axis='both',which='major',labelsize=14)

plt.scatter(x_values,y_values,c=y_values,cmap=plt.cm.Blues,edgecolor='none',s=40)

plt.axis([0,1100,0,1100000])

plt.show()
# ~ plt.savefig('squares_plot.png',bbox_inches='tight')
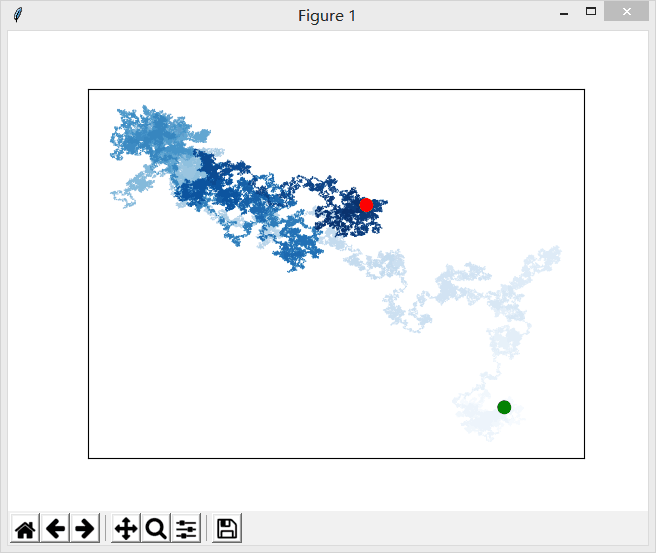
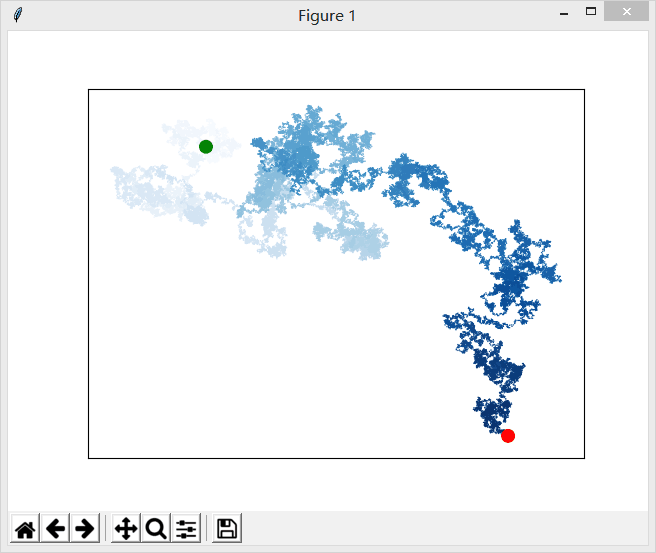
三、随机漫步
1、创建RandomWalk()类


 1 from random import choice
 2
 3 class RandomWalk():
 4
 5     def __init__(self,num_points=5000):
 6         self.num_points=num_points
 7
 8         #all random walk from (0,0)
 9         self.x_values=[0]
10         self.y_values=[0]
11
12     def fill_walk(self):
13
14         while len(self.x_values)<self.num_points:
15             x_direction=choice([1,-1])
16             x_distance=choice([0,1,2,3,4])
17             x_step=x_direction*x_distance
18
19             y_direction=choice([1,-1])
20             y_distance=choice([0,1,2,3,4])
21             y_step=y_direction*y_distance
22
23             if x_step==0 and y_step==0:
24                 continue
25
26             next_x=self.x_values[-1]+x_step
27             next_y=self.y_values[-1]+y_step
28
29             self.x_values.append(next_x)
30             self.y_values.append(next_y)
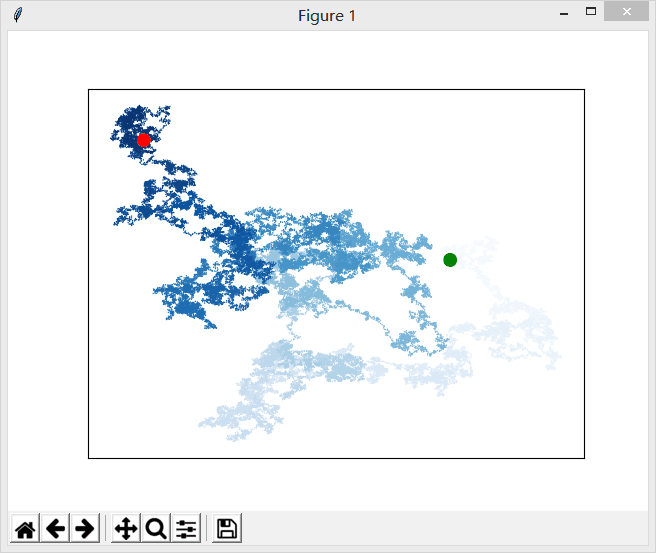
2、绘制随机漫步图
 1 import matplotlib.pyplot as plt
 2
 3 from random_walk import RandomWalk
 4
 5 while True:
 6     rw=RandomWalk(50000)
 7     rw.fill_walk()
 8
 9     point_numbers=list(range(rw.num_points))
10     plt.scatter(rw.x_values,rw.y_values,c=point_numbers,cmap=plt.cm.Blues,
11         edgecolor='none',s=1)
12
13     plt.scatter(0,0,c='green',edgecolors='none',s=100)
14     plt.scatter(rw.x_values[-1],rw.y_values[-1],c='red',edgecolors='none',
15         s=100)
16
17     plt.axes().get_xaxis().set_visible(False)
18     plt.axes().get_yaxis().set_visible(False)
19
20     plt.show()
21
22     keep_running=input('Make another walk?(y/n): ')
23     if keep_running=='n':
24         break
待解决的问题,matplotlib不支持中文和中文注释。