容器监控与报警
容器监控的实现方对比虚拟机或者物理机来说比大的区别,比如容器在k8s环境中可以任意横向扩容与缩容,那么就需要监控服务能够自动对新创建的容器进行监控,当容器删除后又能够及时的从监控服务中删除,而传统的zabbix的监控方式需要在每一个容器中安装启动agent,并且在容器自动发现注册及模板关联方面并没有比较好的实现方式。
| role | host | port |
|---|---|---|
| Prometheus | master2(10.203.104.21) | 9090 |
| node exporter | master/node | 9100 |
| Grafana | master3(10.203.104.22) | 3000 |
| cadvisor | node | 8080 |
| alertmanager | master3 | 9093 |
| haproxy_exporter | HA1(10.203.104.30) | 9101 |
Prometheus
k8s的早期版本基于组件heapster实现对pod和node节点的监控功能,但是从k8s 1.8版本开始使用metrics API的方式监控,并在1.11版本 正式将heapster替换,后期的k8s监控主要是通过metrics Server提供核心监控指标,比如Node节点的CPU和内存使用率,其他的监控交由另外一个组件Prometheus 完成
prometheus简介
https://prometheus.io/docs/ #官方文档
https://github.com/prometheus #github地址
Prometheus是基于go语言开发的一套开源的监控、报警和时间序列数据库的组合,是由SoundCloud公司开发的开源监控系统,Prometheus是CNCF(Cloud Native Computing Foundation,云原生计算基金会)继kubernetes 之后毕业的第二个项目,prometheus在容器和微服务领域中得到了广泛的应用,其特点主要如下
使用key-value的多维度格式保存数据
数据不使用MySQL这样的传统数据库,而是使用时序数据库,目前是使用的TSDB
支持第三方dashboard实现更高的图形界面,如grafana(Grafana 2.5.0版本及以上)
功能组件化
不需要依赖存储,数据可以本地保存也可以远程保存
服务自动化发现
强大的数据查询语句功(PromQL,Prometheus Query Language)
prometheus系统架构
prometheus server:主服务,接受外部http请求,收集、存储与查询数据等
prometheus targets: 静态收集的目标服务数据
service discovery:动态发现服务
prometheus alerting:报警通知
pushgateway:数据收集代理服务器(类似于zabbix proxy)
data visualization and export: 数据可视化与数据导出(访问客户端)
prometheus 安装方式
https://prometheus.io/download/ #官方二进制下载及安装,prometheus server的监听端口为9090
https://prometheus.io/docs/prometheus/latest/installation/ #docker镜像直接启动
https://github.com/coreos/kube-prometheus #operator部署
容器方式安装prometheus
本次环境在Master2(10.203.104.21)中安装prometheus
运行prometheus容器
root@master2:~# docker run
    -p 9090:9090
    prom/prometheus
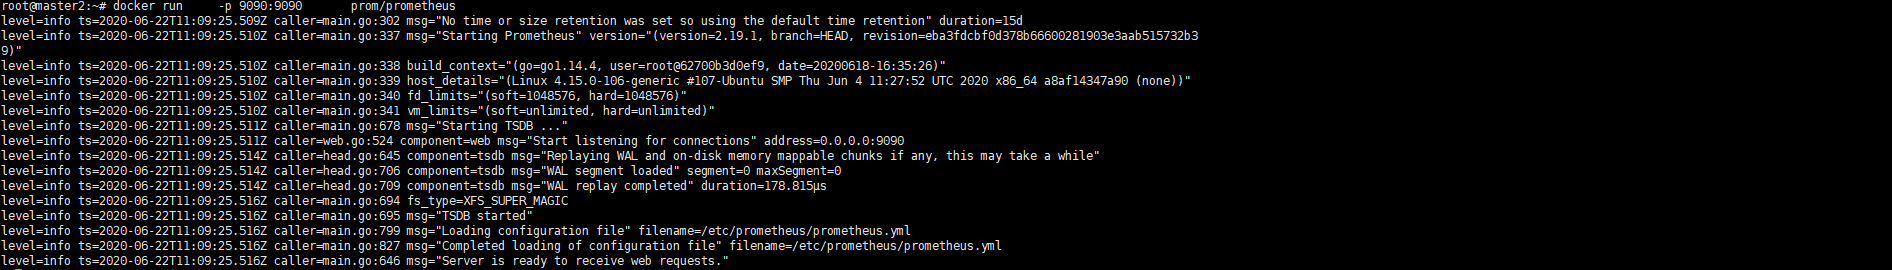
在浏览器中访问master2节点的9090端口测试prometheus
operator部署
https://github.com/coreos/kube-prometheus
克隆项目
root@master1:/usr/local/src# git clone https://github.com/coreos/kube-prometheus.git
root@master1:/usr/local/src# cd kube-prometheus-release-0.4/
root@master1:/usr/local/src/kube-prometheus-release-0.4# ls
build.sh            DCO   example.jsonnet  experimental  go.sum  jsonnet           jsonnetfile.lock.json  LICENSE   manifests  OWNERS     scripts                            tests
code-of-conduct.md  docs  examples         go.mod        hack    jsonnetfile.json  kustomization.yaml     Makefile  NOTICE     README.md  sync-to-internal-registry.jsonnet  test.sh

root@master1:/usr/local/src/kube-prometheus-release-0.4# cd manifests/
root@master1:/usr/local/src/kube-prometheus-release-0.4/manifests# ls

创建账号规则
root@master1:/usr/local/src/kube-prometheus-release-0.4/manifests# kubectl apply -f setup/
namespace/monitoring created
customresourcedefinition.apiextensions.k8s.io/alertmanagers.monitoring.coreos.com created
customresourcedefinition.apiextensions.k8s.io/podmonitors.monitoring.coreos.com created
customresourcedefinition.apiextensions.k8s.io/prometheuses.monitoring.coreos.com created
customresourcedefinition.apiextensions.k8s.io/prometheusrules.monitoring.coreos.com created
customresourcedefinition.apiextensions.k8s.io/servicemonitors.monitoring.coreos.com created
clusterrole.rbac.authorization.k8s.io/prometheus-operator created
clusterrolebinding.rbac.authorization.k8s.io/prometheus-operator created
deployment.apps/prometheus-operator created
service/prometheus-operator created
serviceaccount/prometheus-operator created
创建prometheus
root@master1:/usr/local/src/kube-prometheus-release-0.4/manifests# kubectl apply -f .
alertmanager.monitoring.coreos.com/main created
secret/alertmanager-main created
service/alertmanager-main created
serviceaccount/alertmanager-main created
servicemonitor.monitoring.coreos.com/alertmanager created
secret/grafana-datasources created
configmap/grafana-dashboard-apiserver created
configmap/grafana-dashboard-cluster-total created
configmap/grafana-dashboard-controller-manager created
configmap/grafana-dashboard-k8s-resources-cluster created
configmap/grafana-dashboard-k8s-resources-namespace created
configmap/grafana-dashboard-k8s-resources-node created
configmap/grafana-dashboard-k8s-resources-pod created
configmap/grafana-dashboard-k8s-resources-workload created
configmap/grafana-dashboard-k8s-resources-workloads-namespace created
configmap/grafana-dashboard-kubelet created
configmap/grafana-dashboard-namespace-by-pod created
configmap/grafana-dashboard-namespace-by-workload created
configmap/grafana-dashboard-node-cluster-rsrc-use created
configmap/grafana-dashboard-node-rsrc-use created
configmap/grafana-dashboard-nodes created
configmap/grafana-dashboard-persistentvolumesusage created
configmap/grafana-dashboard-pod-total created
configmap/grafana-dashboard-pods created
configmap/grafana-dashboard-prometheus-remote-write created
configmap/grafana-dashboard-prometheus created
configmap/grafana-dashboard-proxy created
configmap/grafana-dashboard-scheduler created
configmap/grafana-dashboard-statefulset created
configmap/grafana-dashboard-workload-total created
configmap/grafana-dashboards created
deployment.apps/grafana created
service/grafana created
serviceaccount/grafana created
servicemonitor.monitoring.coreos.com/grafana created
clusterrole.rbac.authorization.k8s.io/kube-state-metrics created
clusterrolebinding.rbac.authorization.k8s.io/kube-state-metrics created
deployment.apps/kube-state-metrics created
role.rbac.authorization.k8s.io/kube-state-metrics created
rolebinding.rbac.authorization.k8s.io/kube-state-metrics created
service/kube-state-metrics created
serviceaccount/kube-state-metrics created
servicemonitor.monitoring.coreos.com/kube-state-metrics created
clusterrole.rbac.authorization.k8s.io/node-exporter created
clusterrolebinding.rbac.authorization.k8s.io/node-exporter created
daemonset.apps/node-exporter created
service/node-exporter created
serviceaccount/node-exporter created
servicemonitor.monitoring.coreos.com/node-exporter created
apiservice.apiregistration.k8s.io/v1beta1.metrics.k8s.io configured
clusterrole.rbac.authorization.k8s.io/prometheus-adapter created
clusterrole.rbac.authorization.k8s.io/system:aggregated-metrics-reader unchanged
clusterrolebinding.rbac.authorization.k8s.io/prometheus-adapter created
clusterrolebinding.rbac.authorization.k8s.io/resource-metrics:system:auth-delegator created
clusterrole.rbac.authorization.k8s.io/resource-metrics-server-resources created
configmap/adapter-config created
deployment.apps/prometheus-adapter created
rolebinding.rbac.authorization.k8s.io/resource-metrics-auth-reader created
service/prometheus-adapter created
serviceaccount/prometheus-adapter created
clusterrole.rbac.authorization.k8s.io/prometheus-k8s created
clusterrolebinding.rbac.authorization.k8s.io/prometheus-k8s created
servicemonitor.monitoring.coreos.com/prometheus-operator created
prometheus.monitoring.coreos.com/k8s created
rolebinding.rbac.authorization.k8s.io/prometheus-k8s-config created
rolebinding.rbac.authorization.k8s.io/prometheus-k8s created
rolebinding.rbac.authorization.k8s.io/prometheus-k8s created
rolebinding.rbac.authorization.k8s.io/prometheus-k8s created
role.rbac.authorization.k8s.io/prometheus-k8s-config created
role.rbac.authorization.k8s.io/prometheus-k8s created
role.rbac.authorization.k8s.io/prometheus-k8s created
role.rbac.authorization.k8s.io/prometheus-k8s created
prometheusrule.monitoring.coreos.com/prometheus-k8s-rules created
service/prometheus-k8s created
serviceaccount/prometheus-k8s created
servicemonitor.monitoring.coreos.com/prometheus created
servicemonitor.monitoring.coreos.com/kube-apiserver created
servicemonitor.monitoring.coreos.com/coredns created
servicemonitor.monitoring.coreos.com/kube-controller-manager created
servicemonitor.monitoring.coreos.com/kube-scheduler created
servicemonitor.monitoring.coreos.com/kubelet created
设置端口转发
$ kubectl --namespace monitoring port-forward --address 0.0.0.0 svc/grafana 3000:3000
$ kubectl --namespace monitoring port-forward --address 0.0.0.0 svc/prometheus-k8s 9090:9090
web访问master1节点3000端口测试(http://10.203.104.20:3000)
基于NodePort暴露服务
grafana
root@master1:/usr/local/src/kube-prometheus-release-0.4/manifests# cat grafana-service.yaml
apiVersion: v1
kind: Service
metadata:
  labels:
    app: grafana
  name: grafana
  namespace: monitoring
spec:
  ports:
  - name: http
    port: 3000
    targetPort: 3000
    nodePort: 33000
  selector:
    app: grafana

root@master1:/usr/local/src/kube-prometheus-release-0.4/manifests# kubectl apply -f grafana-service.yaml
web访问master1节点3000端口测试(http://10.203.104.20:33000)
prometheus
root@master1:/usr/local/src/kube-prometheus-release-0.4/manifests# cat prometheus-service.yaml
apiVersion: v1
kind: Service
metadata:
  labels:
    prometheus: k8s
  name: prometheus-k8s
  namespace: monitoring
spec:
  ports:
  - name: web
    port: 9090
    targetPort: web
  selector:
    app: prometheus
    prometheus: k8s
    nodePort: 39090
  sessionAffinity: ClientIP

 root@master1:/usr/local/src/kube-prometheus-release-0.4/manifests# kubectl apply -f prometheus-service.yaml
二进制方式安装
本次环境在Master2中安装prometheus
解压二进制压缩包文件
root@master2:/usr/local/src# ls
prometheus-2.17.1.linux-amd64.tar.gz

root@master2:/usr/local/src# tar -zxvf prometheus-2.17.1.linux-amd64.tar.gz
prometheus-2.17.1.linux-amd64/
prometheus-2.17.1.linux-amd64/NOTICE
prometheus-2.17.1.linux-amd64/LICENSE
prometheus-2.17.1.linux-amd64/prometheus.yml
prometheus-2.17.1.linux-amd64/prometheus
prometheus-2.17.1.linux-amd64/promtool
prometheus-2.17.1.linux-amd64/console_libraries/
prometheus-2.17.1.linux-amd64/console_libraries/menu.lib
prometheus-2.17.1.linux-amd64/console_libraries/prom.lib
prometheus-2.17.1.linux-amd64/consoles/
prometheus-2.17.1.linux-amd64/consoles/prometheus-overview.html
prometheus-2.17.1.linux-amd64/consoles/index.html.example
prometheus-2.17.1.linux-amd64/consoles/node-cpu.html
prometheus-2.17.1.linux-amd64/consoles/node-overview.html
prometheus-2.17.1.linux-amd64/consoles/node.html
prometheus-2.17.1.linux-amd64/consoles/node-disk.html
prometheus-2.17.1.linux-amd64/consoles/prometheus.html
prometheus-2.17.1.linux-amd64/tsdb
prometheus目录创建软链接
root@master2:/usr/local/src# ln -sv /usr/local/src/prometheus-2.17.1.linux-amd64 /usr/local/prometheus
'/usr/local/prometheus' -> '/usr/local/src/prometheus-2.17.1.linux-amd64'
root@master2:/usr/local/src# cd /usr/local/prometheus
root@master2:/usr/local/prometheus# ls
console_libraries  consoles  LICENSE  NOTICE  prometheus  prometheus.yml  promtool  tsdb
创建prometheus启动脚本
root@master2:/usr/local/prometheus# vim /etc/systemd/system/prometheus.service
[Unit]
Description=Prometheus Server
Documentation=https://prometheus.io/docs/introduction/overview/
After=network.target

[Service]
Restart=on-failure
WorkingDirectory=/usr/local/prometheus/
ExecStart=/usr/local/prometheus/prometheus --config.file=/usr/local/prometheus/prometheus.yml
[Install]

WantedBy=multi-user.target
启动prometheus服务
root@master2:/usr/local/prometheus# systemctl start prometheus
root@master2:/usr/local/prometheus# systemctl status prometheus
root@master2:/usr/local/prometheus# systemctl enable prometheus
Created symlink /etc/systemd/system/multi-user.target.wants/prometheus.service → /etc/systemd/system/prometheus.service.
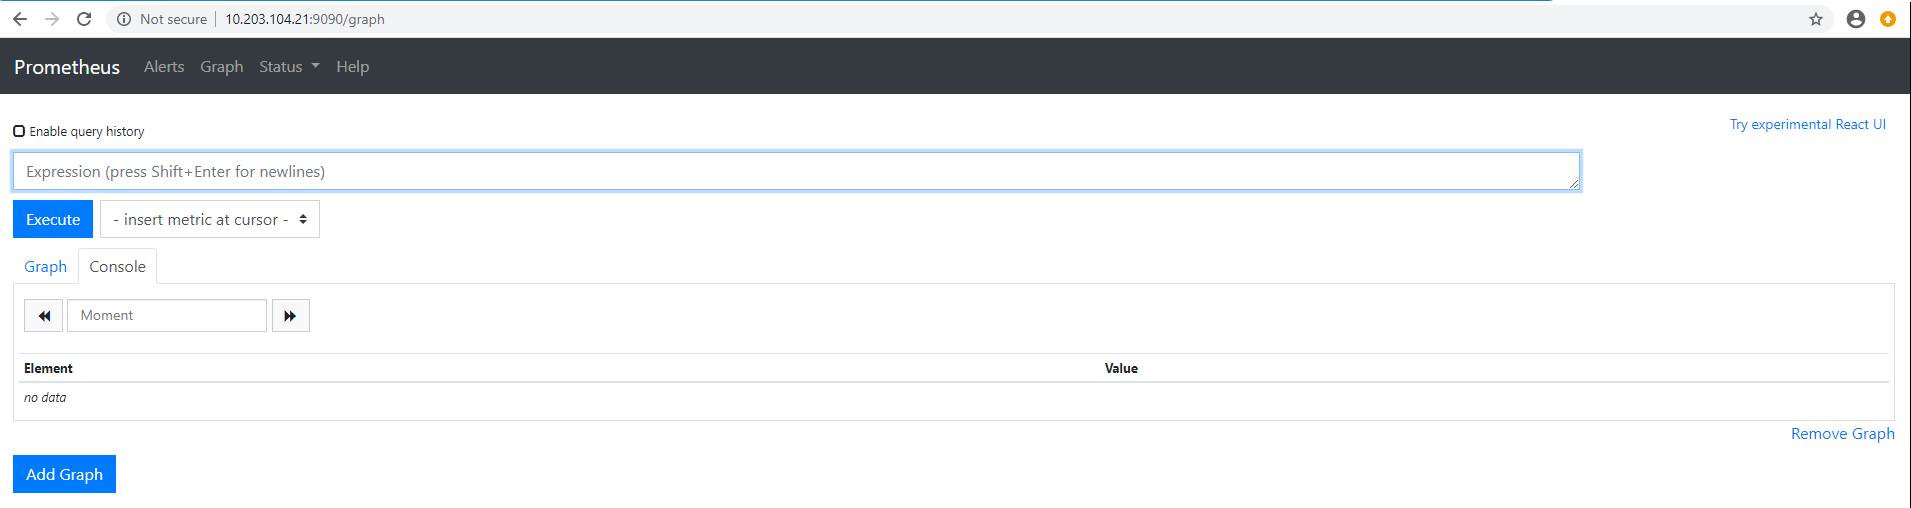
访问prometheus web界面
访问prometheus节点的9090端口
node exporter
收集各k8s node节点(master/node)上的监控指标数据,监听端口为9100
二进制方式安装node exporter(master/node)
解压二进制压缩包文件
root@node1:/usr/local/src# ls
node_exporter-0.18.1.linux-amd64.tar.gz

root@node1:/usr/local/src# tar -zxvf node_exporter-0.18.1.linux-amd64.tar.gz
node_exporter-0.18.1.linux-amd64/
node_exporter-0.18.1.linux-amd64/node_exporter
node_exporter-0.18.1.linux-amd64/NOTICE
node_exporter-0.18.1.linux-amd64/LICENSE
node_exporter目录创建软链接
root@node1:/usr/local/src# ln -sv /usr/local/src/node_exporter-0.18.1.linux-amd64 /usr/local/node_exporter
'/usr/local/node_exporter' -> '/usr/local/src/node_exporter-0.18.1.linux-amd64'

root@node1:/usr/local/src# cd /usr/local/node_exporter
root@node1:/usr/local/node_exporter# ls
LICENSE  node_exporter  NOTICE
创建node exporter启动脚本
root@node1:/usr/local/node_exporter# vim /etc/systemd/system/node-exporter.service
[Unit]
Description=Prometheus Node Exporter
After=network.target

[Service]
ExecStart=/usr/local/node_exporter/node_exporter

[Install]
WantedBy=multi-user.target
启动node exporter服务
root@node1:/usr/local/node_exporter# systemctl start node-exporter
root@node1:/usr/local/node_exporter# systemctl status node-exporter
root@node1:/usr/local/node_exporter# systemctl enable node-exporter
Created symlink /etc/systemd/system/multi-user.target.wants/node-exporter.service → /etc/systemd/system/node-exporter.service.
访问node exporter web界面
在k8s的master和node节点分别测试访问9100端口

prometheus采集node 指标数据
配置prometheus通过node exporter采集 监控指标数据
prometheus配置文件
prometheus server的prometheus.yml文件
root@master2:/usr/local/prometheus# cat prometheus.yml
# my global config
global:
  scrape_interval:     15s # Set the scrape interval to every 15 seconds. Default is every 1 minute.
  evaluation_interval: 15s # Evaluate rules every 15 seconds. The default is every 1 minute.
  # scrape_timeout is set to the global default (10s).

# Alertmanager configuration
alerting:
  alertmanagers:
  - static_configs:
    - targets:
      # - alertmanager:9093

# Load rules once and periodically evaluate them according to the global 'evaluation_interval'.
rule_files:
  # - "first_rules.yml"
  # - "second_rules.yml"

# A scrape configuration containing exactly one endpoint to scrape:
# Here it's Prometheus itself.
scrape_configs:
  # The job name is added as a label `job=<job_name>` to any timeseries scraped from this config.
  #- job_name: 'prometheus'

    # metrics_path defaults to '/metrics'
    # scheme defaults to 'http'.

        # static_configs:
        #- targets: ['localhost:9090']

  # 指定node exporter采集的IP及端口
  - job_name: 'prometheus-node'
    static_configs:
    - targets: ['10.203.104.26:9100','10.203.104.27:9100','10.203.104.28:9100']

  - job_name: 'prometheus-master'
    static_configs:
    - targets: ['10.203.104.20:9100','10.203.104.21:9100','10.203.104.22:9100']
重启prometheus服务
root@master2:/usr/local/prometheus# systemctl restart prometheus
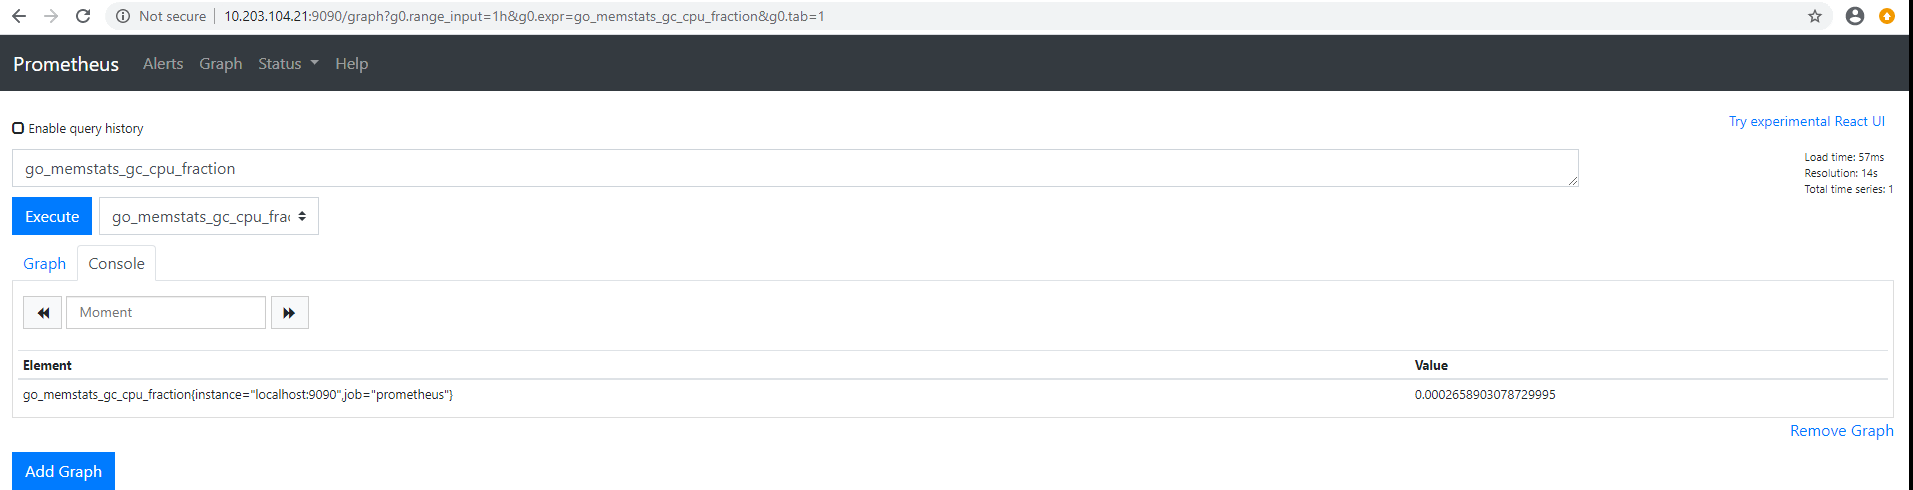
prometheus验证node节点状态

prometheus验证node节点监控数据
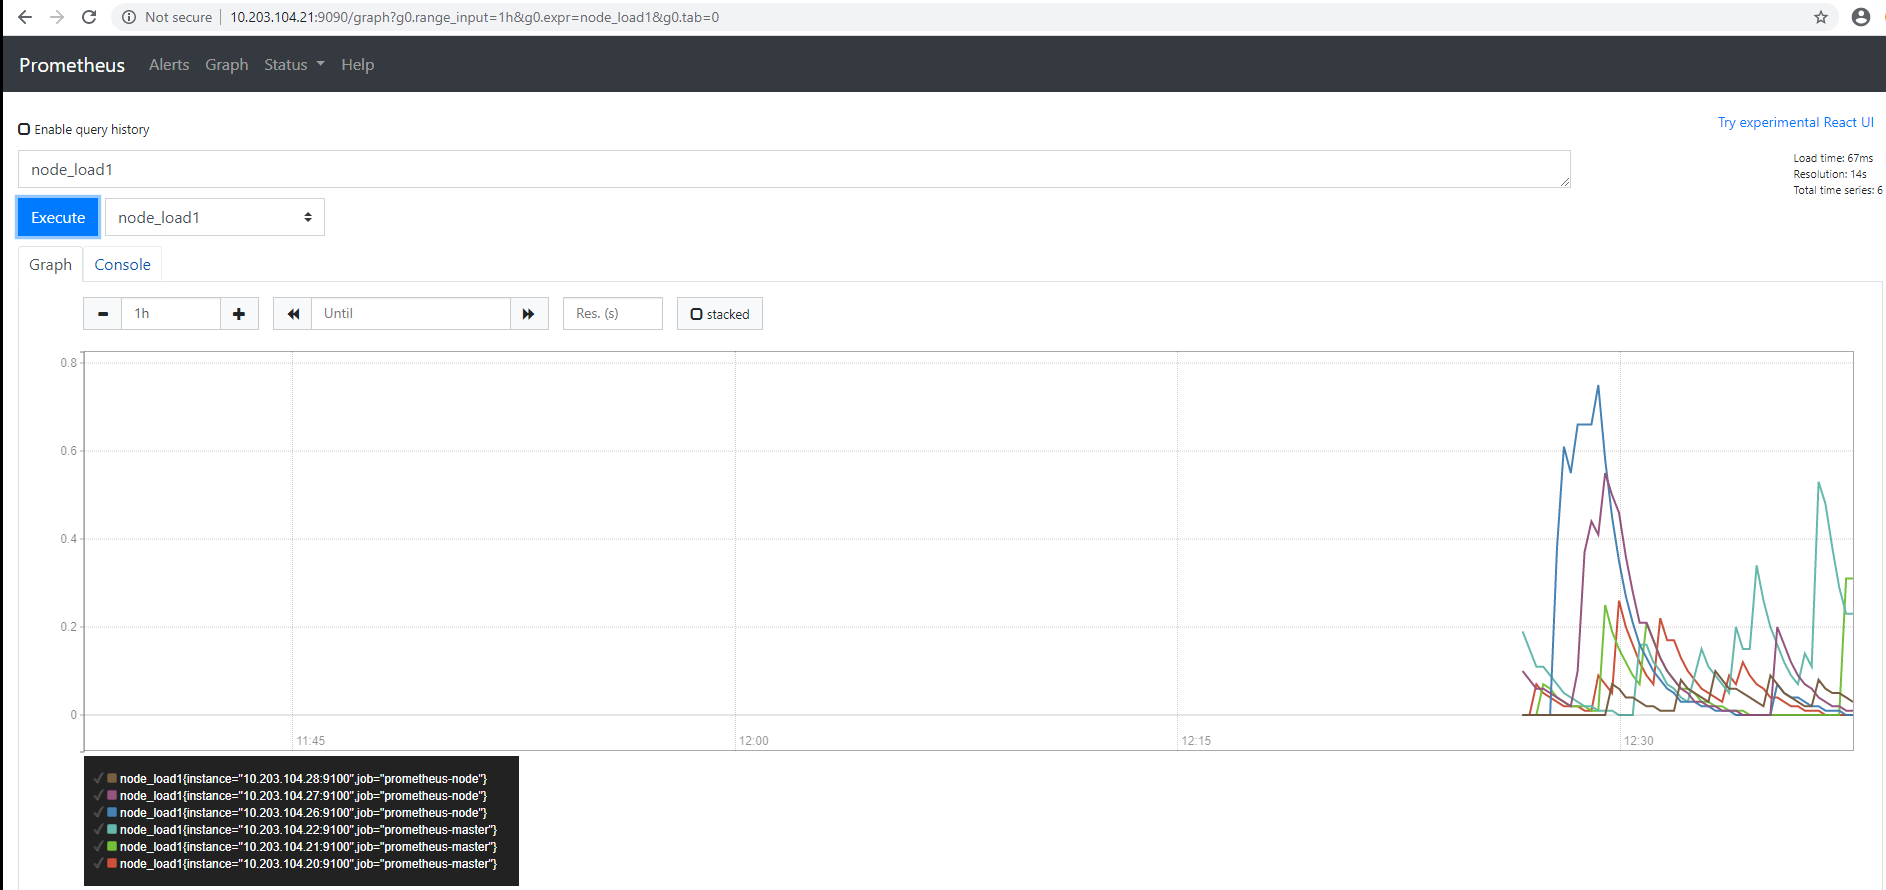
Grafana
https://grafana.com/docs/ #官方安装文档
调用prometheus的数据,进行更专业的可视化
安装grafana
在master3(10.203.104.22)中安装grafana,安装版本为v6.7.2
root@master3:/usr/local/src# apt-get install -y adduser libfontconfig1
 root@master3:/usr/local/src# wget https://dl.grafana.com/oss/release/grafana_6.7.2_amd64.deb
root@master3:/usr/local/src# dpkg -i grafana_6.7.2_amd64.deb
配置文件
root@master3:~# vim /etc/grafana/grafana.ini
[server]
# Protocol (http, https, socket)

protocol = http

# The ip address to bind to, empty will bind to all interfaces

http_addr = 0.0.0.0

# The http port to use

http_port = 3000
启动grafana
root@master3:~# systemctl start grafana-server.service
root@master3:~# systemctl enable grafana-server.service
Synchronizing state of grafana-server.service with SysV service script with /lib/systemd/systemd-sysv-install.
Executing: /lib/systemd/systemd-sysv-install enable grafana-server
Created symlink /etc/systemd/system/multi-user.target.wants/grafana-server.service → /usr/lib/systemd/system/grafana-server.service.
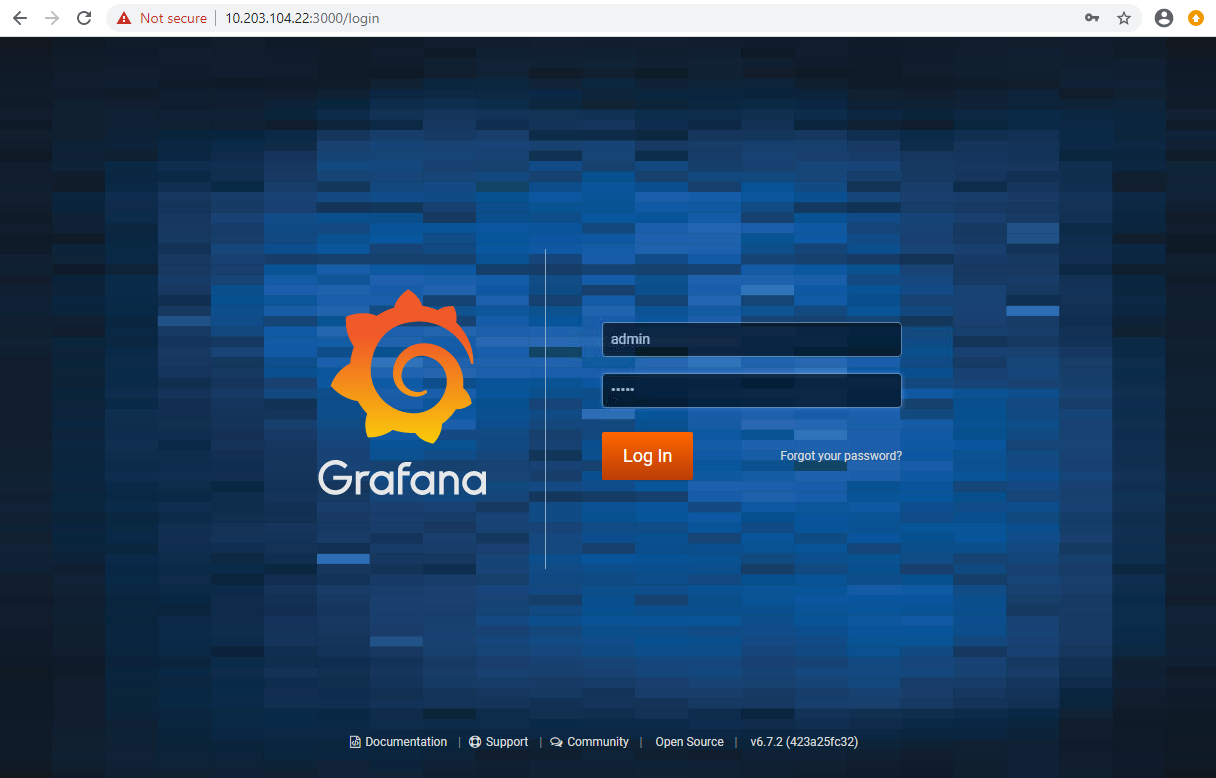
grafana web界面
登录界面
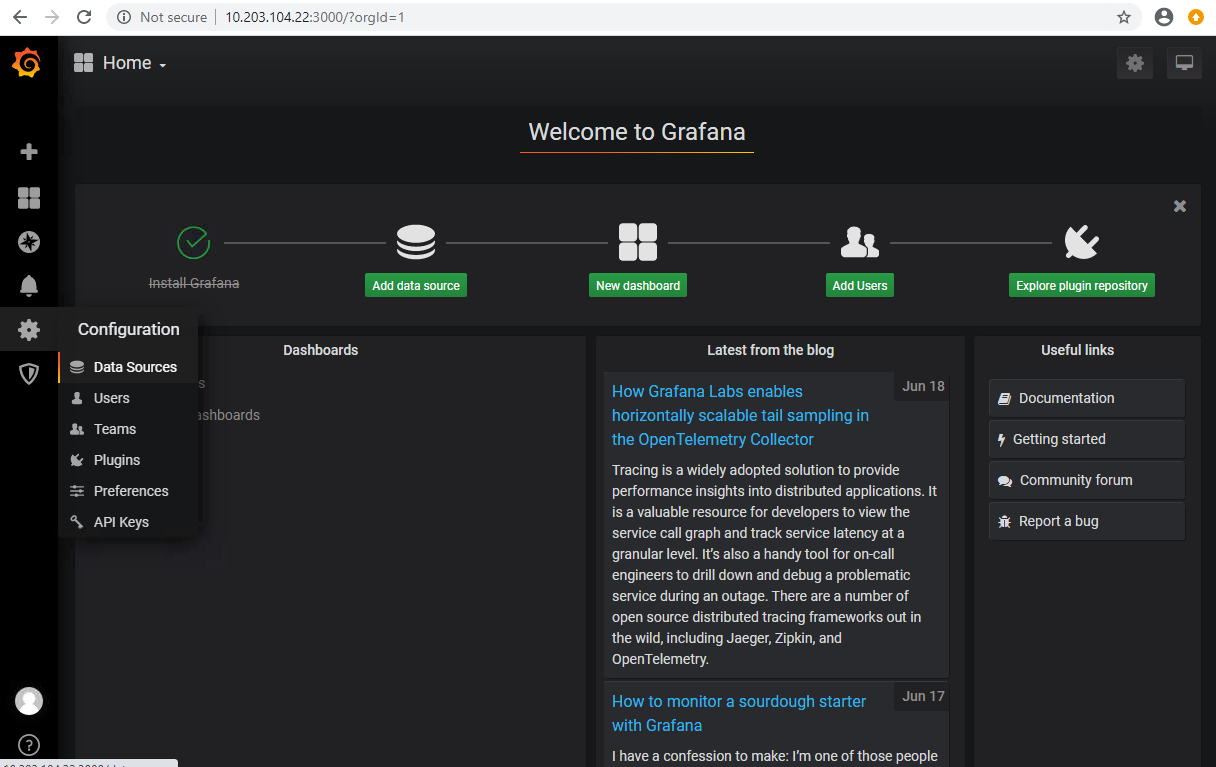
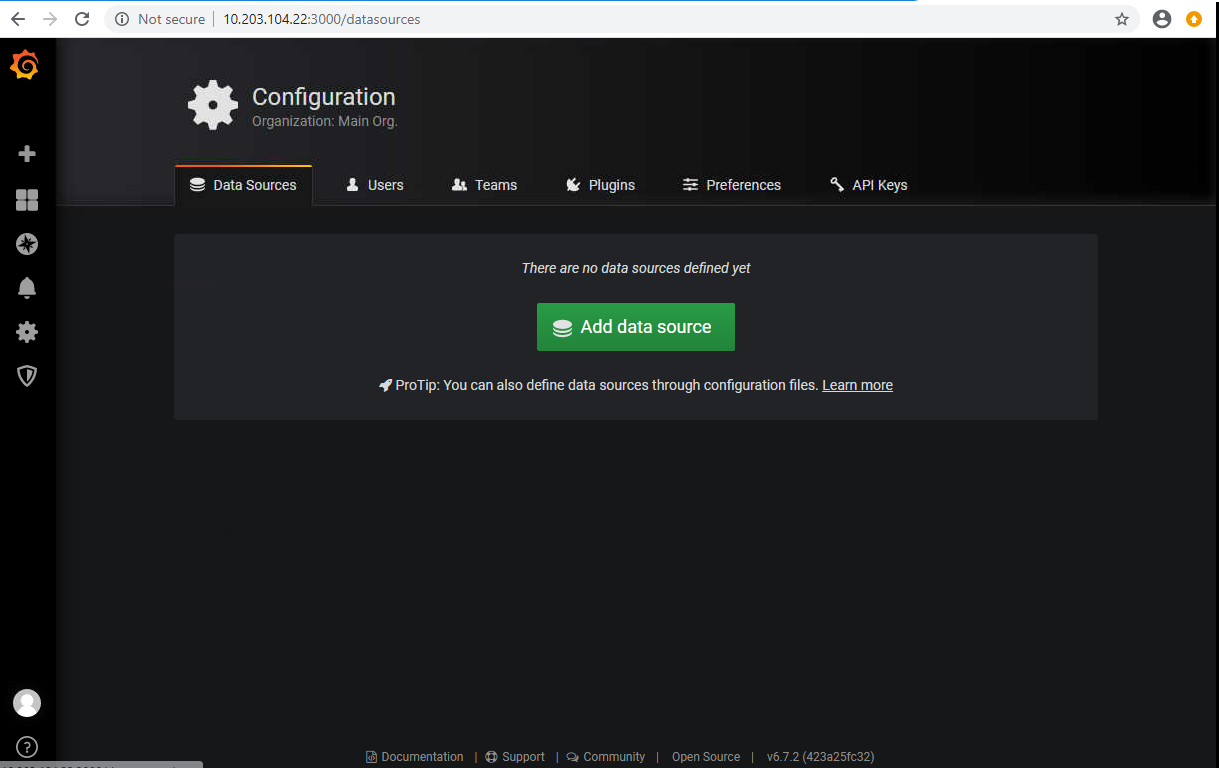
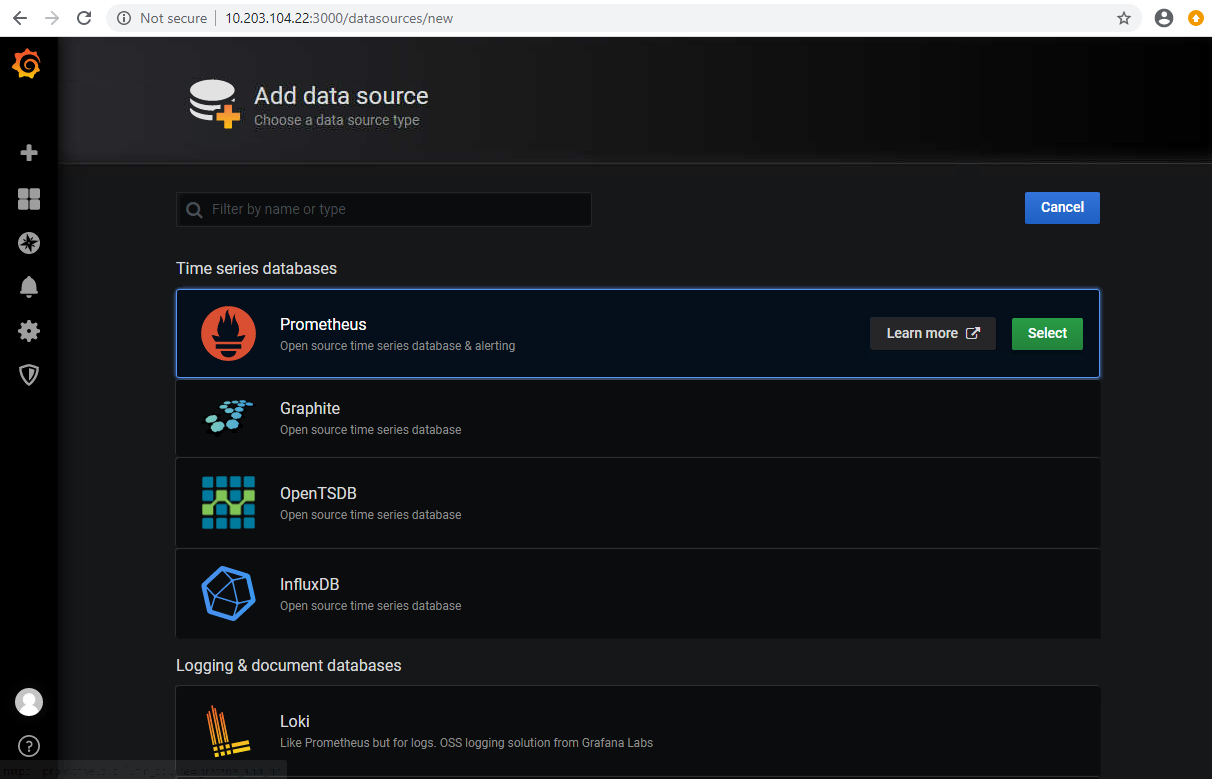
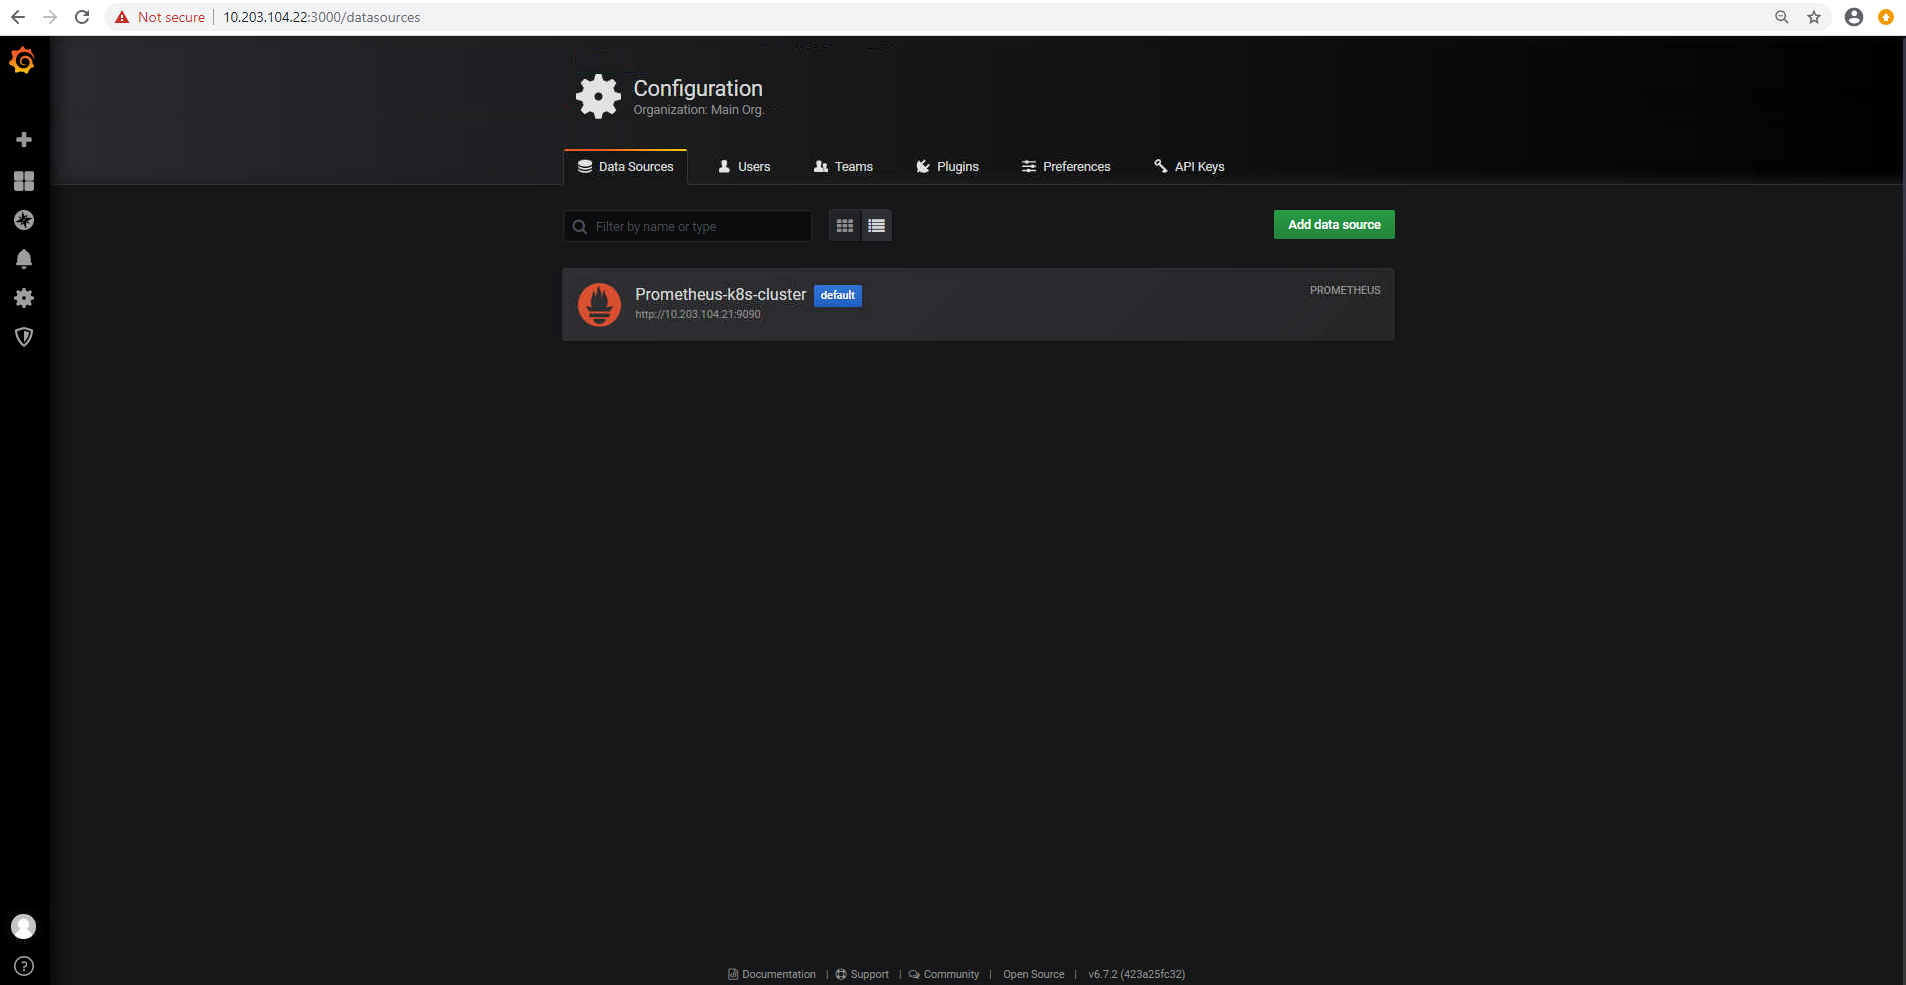
添加prometheus数据源

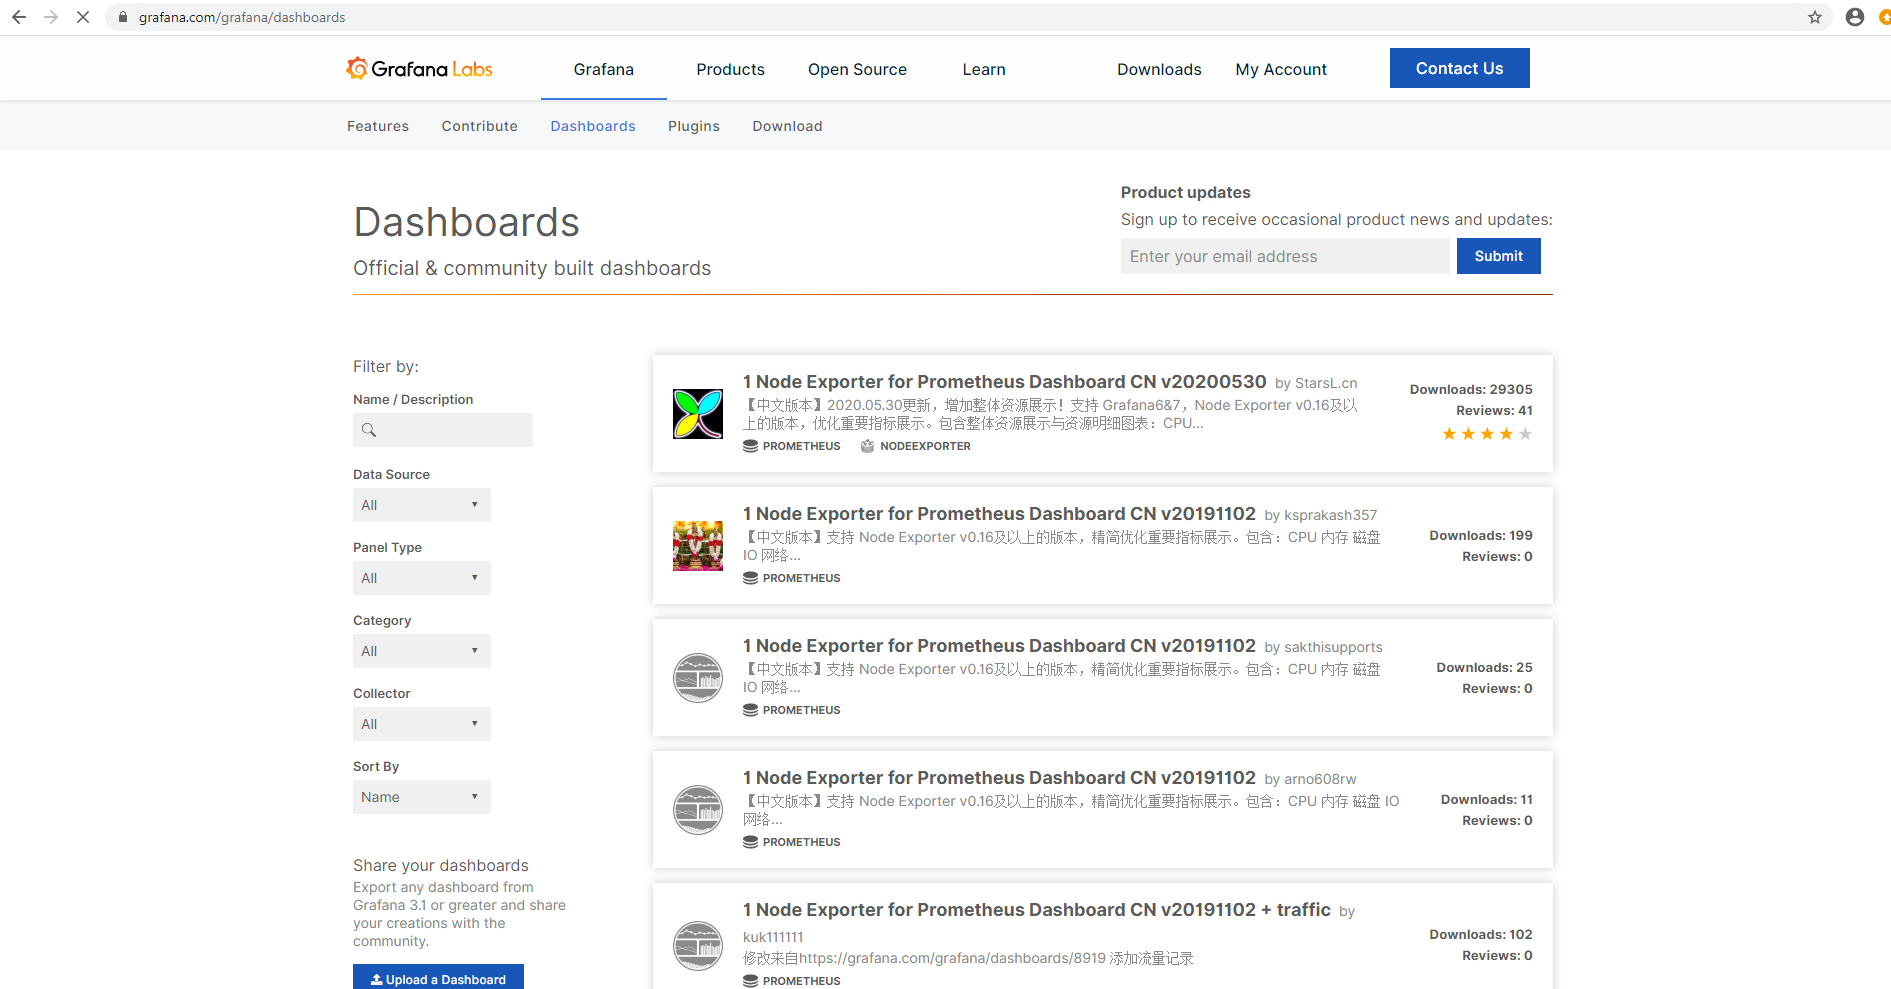
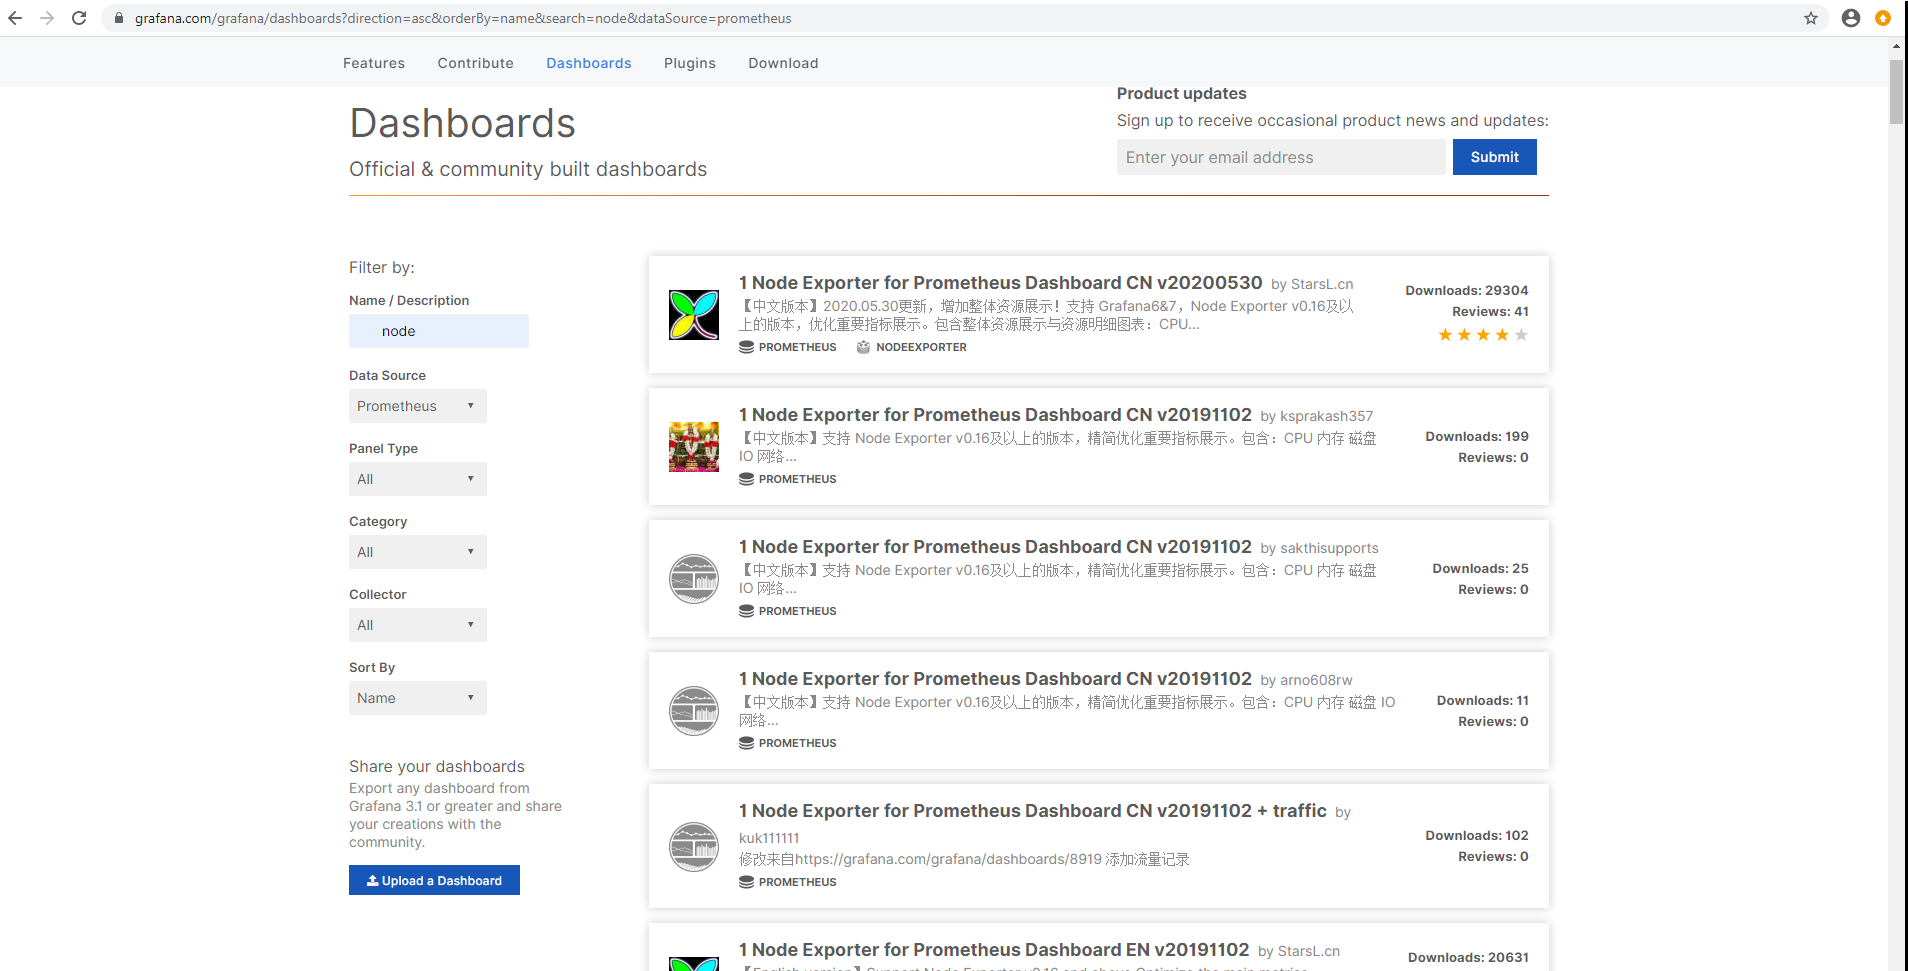
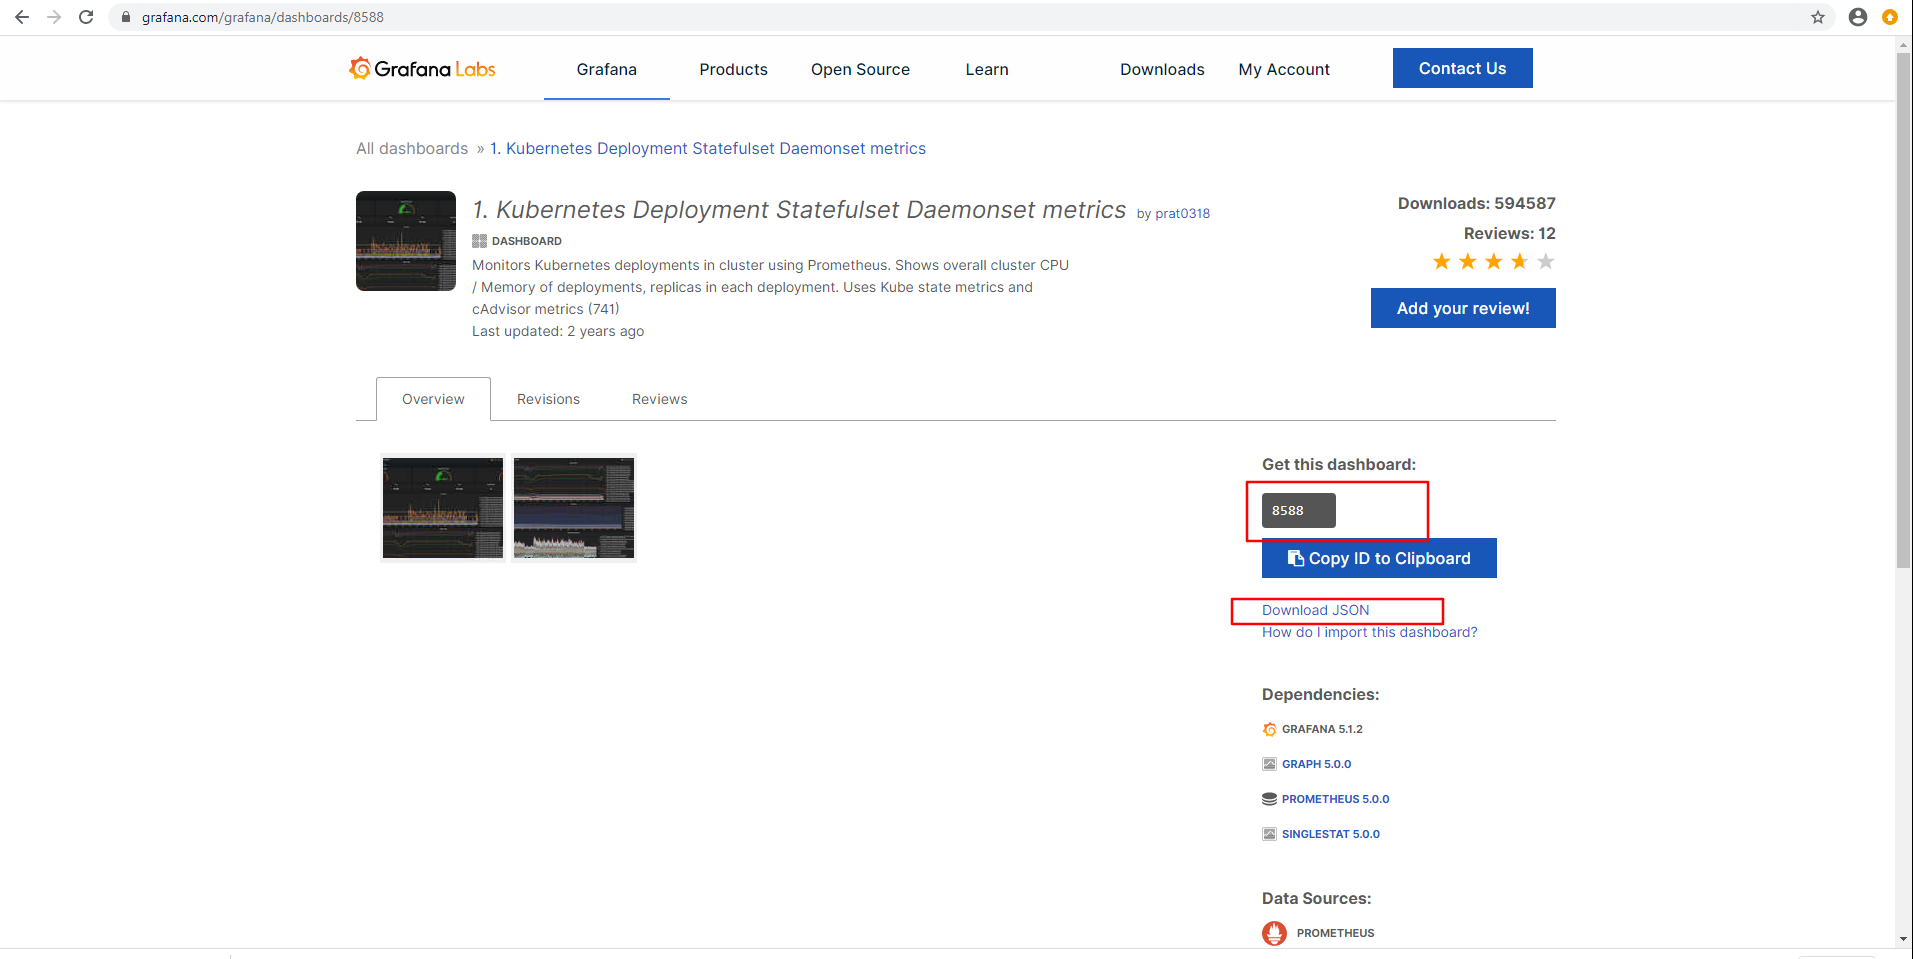
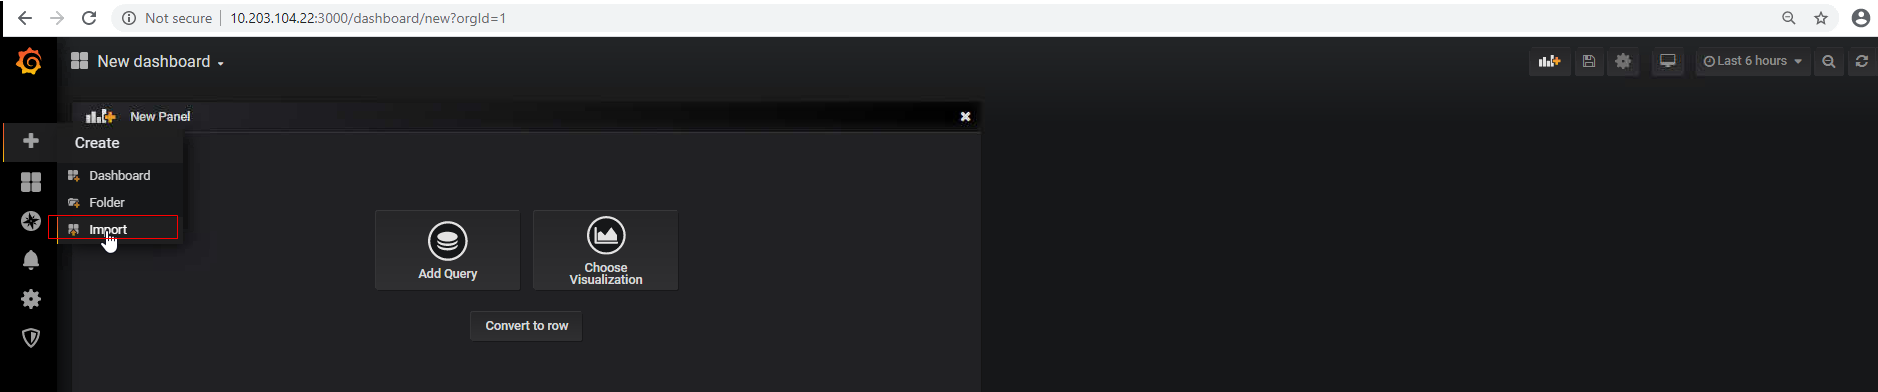
import模板
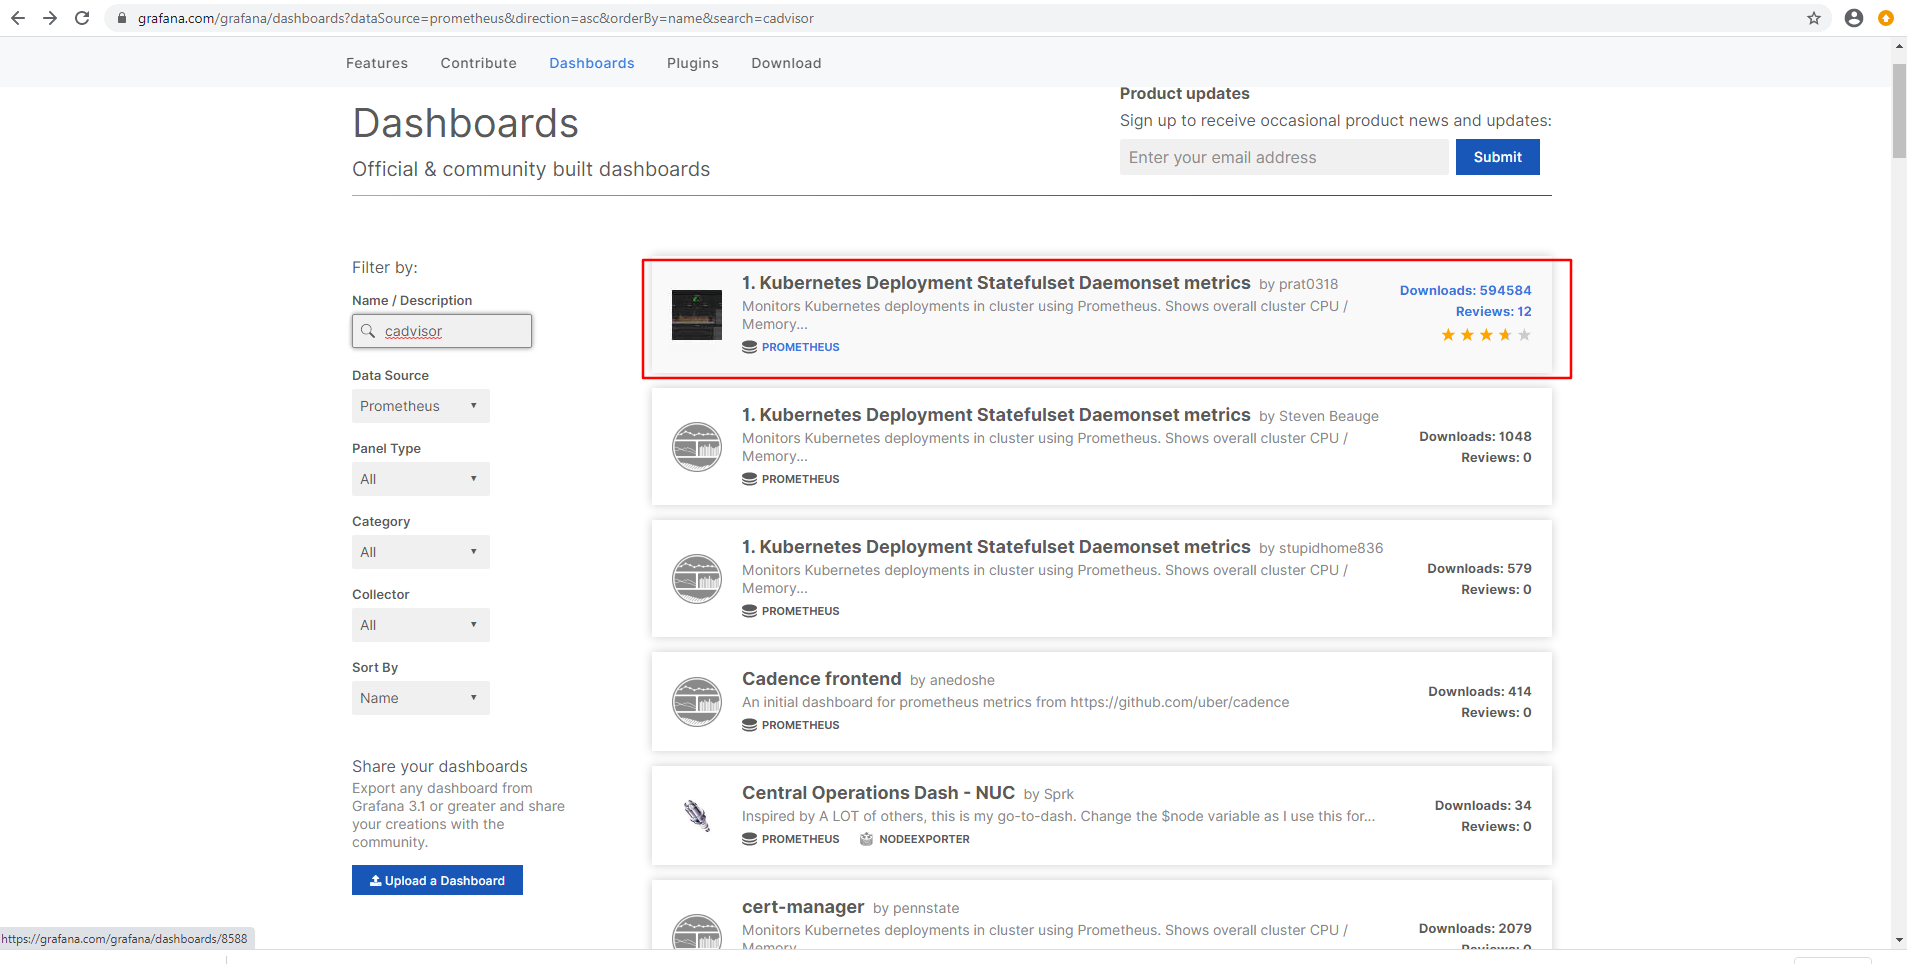
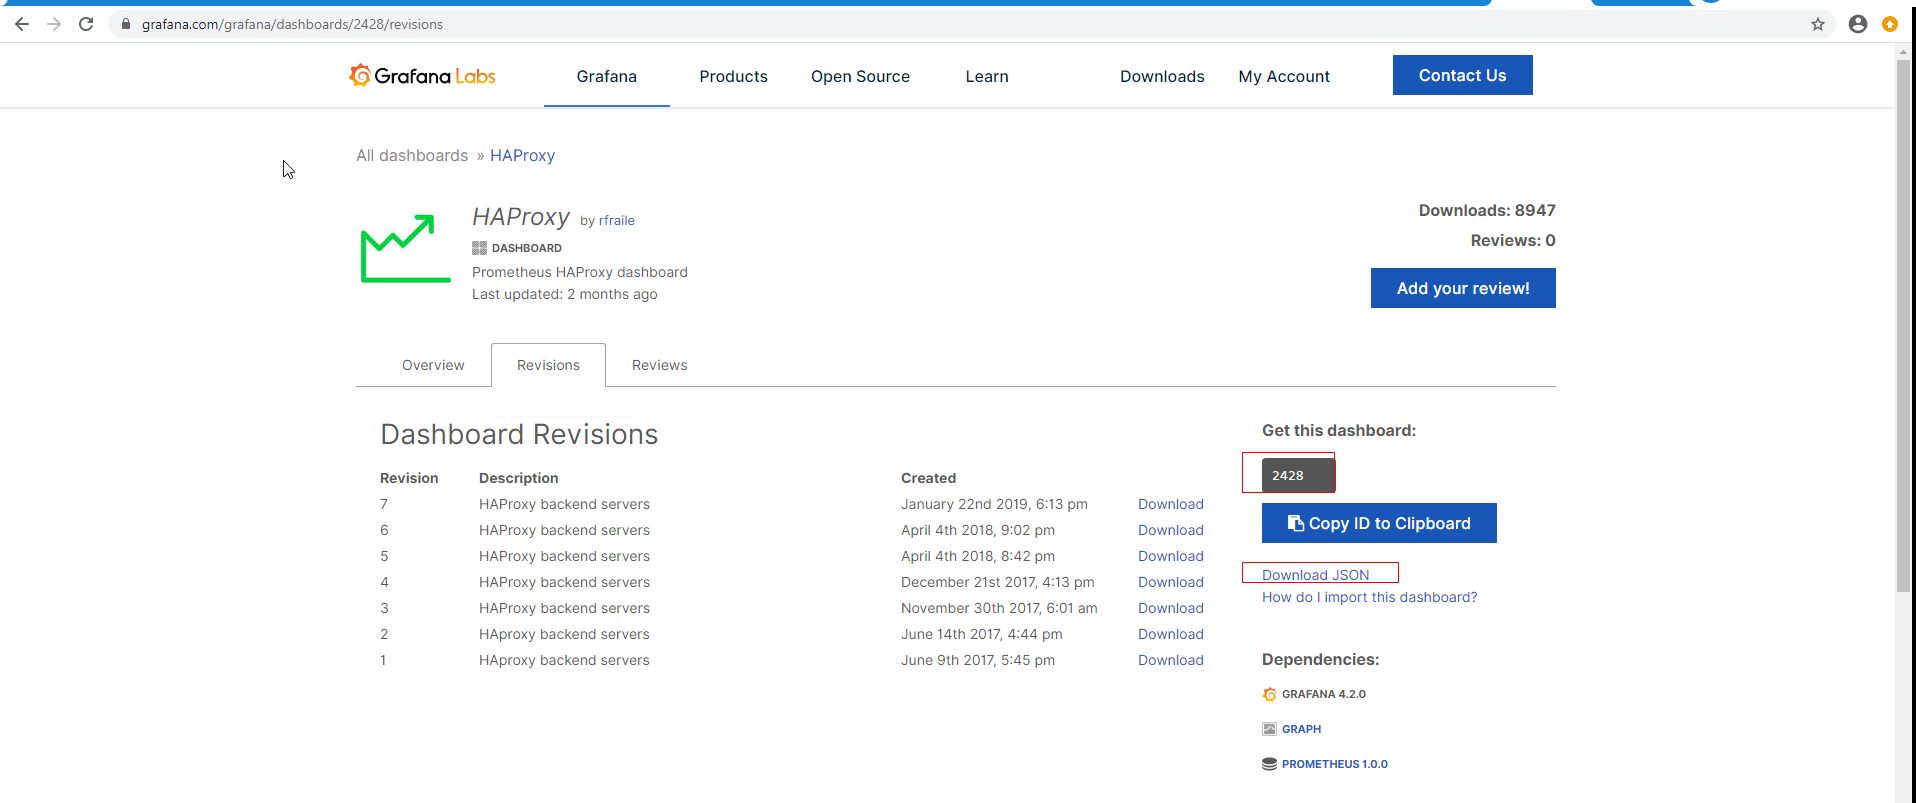
模板下载地址
https://grafana.com/grafana/dashboards
点击目标模板
下载模板

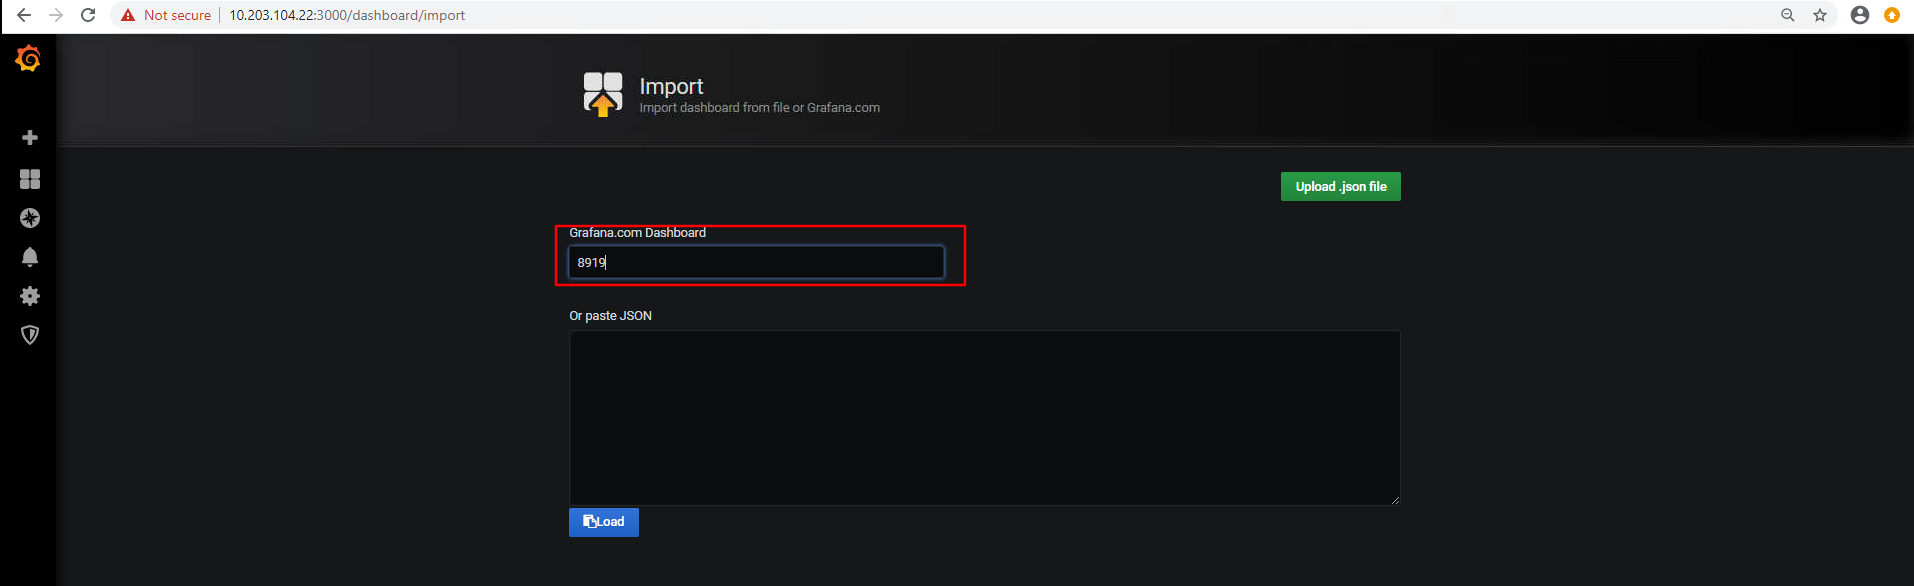
通过模板ID导入
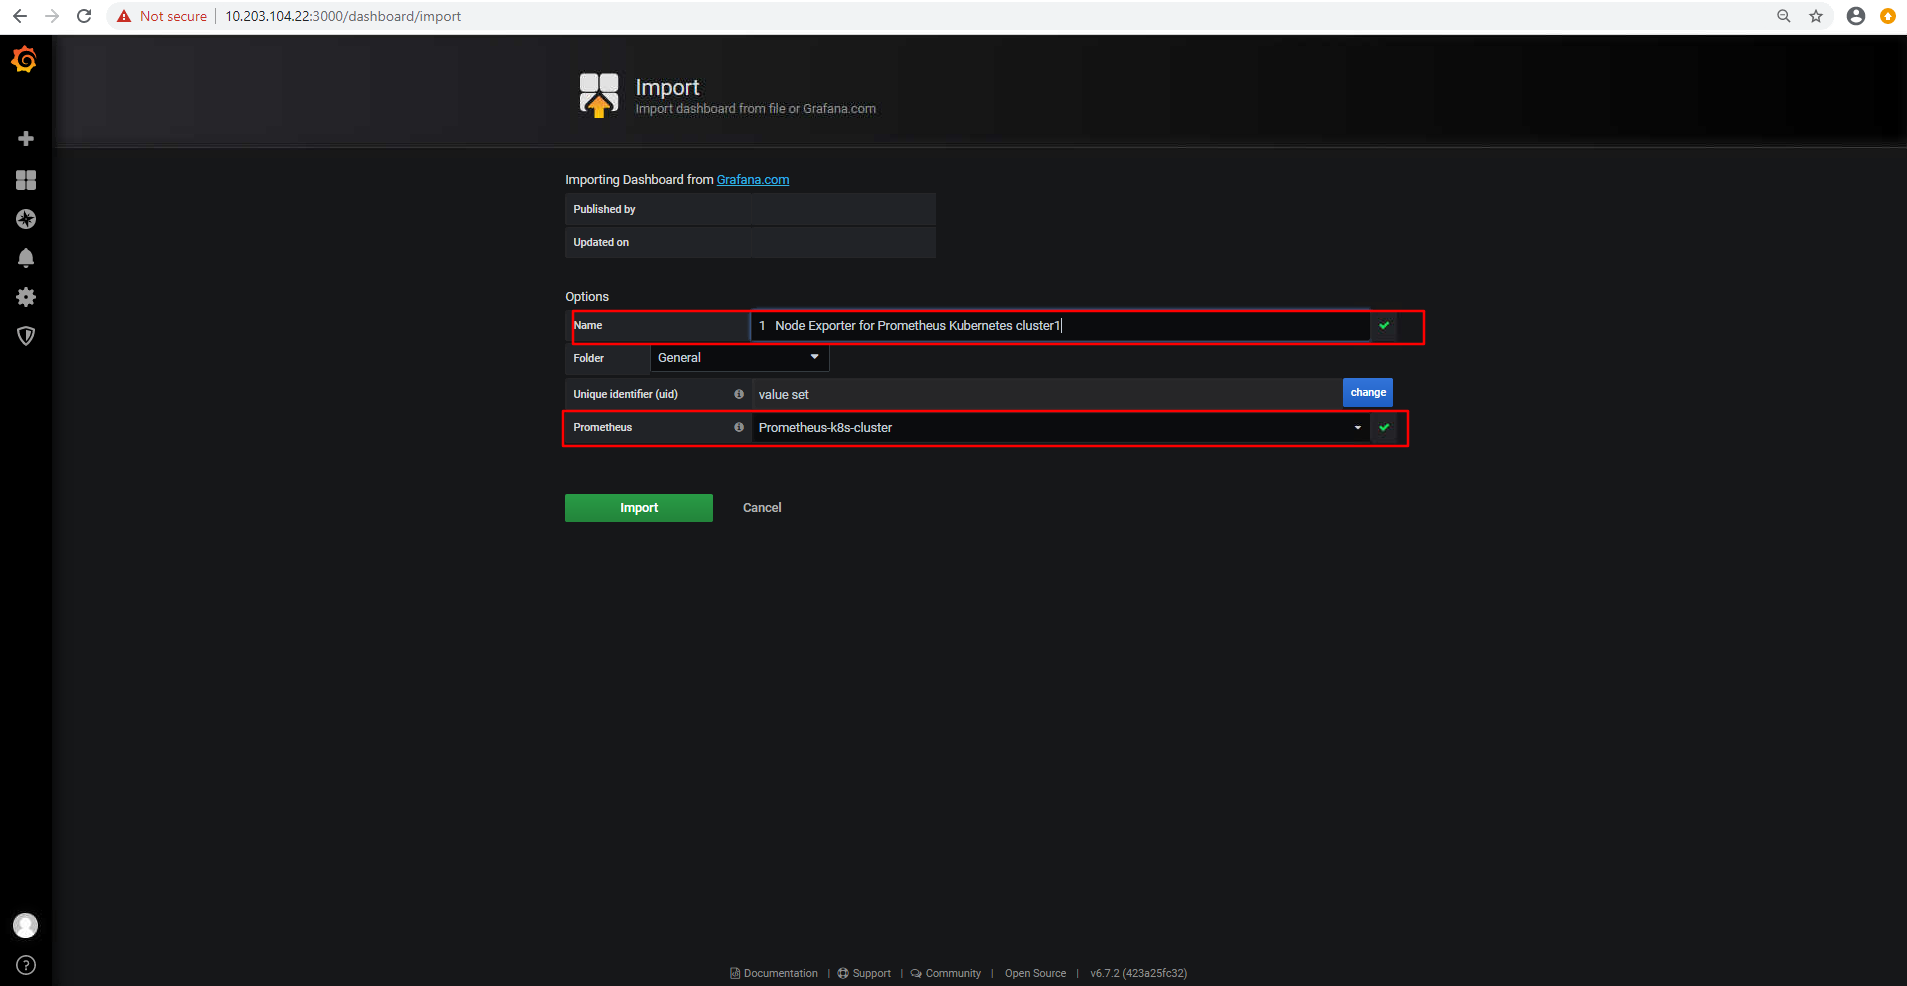
确认模板信息
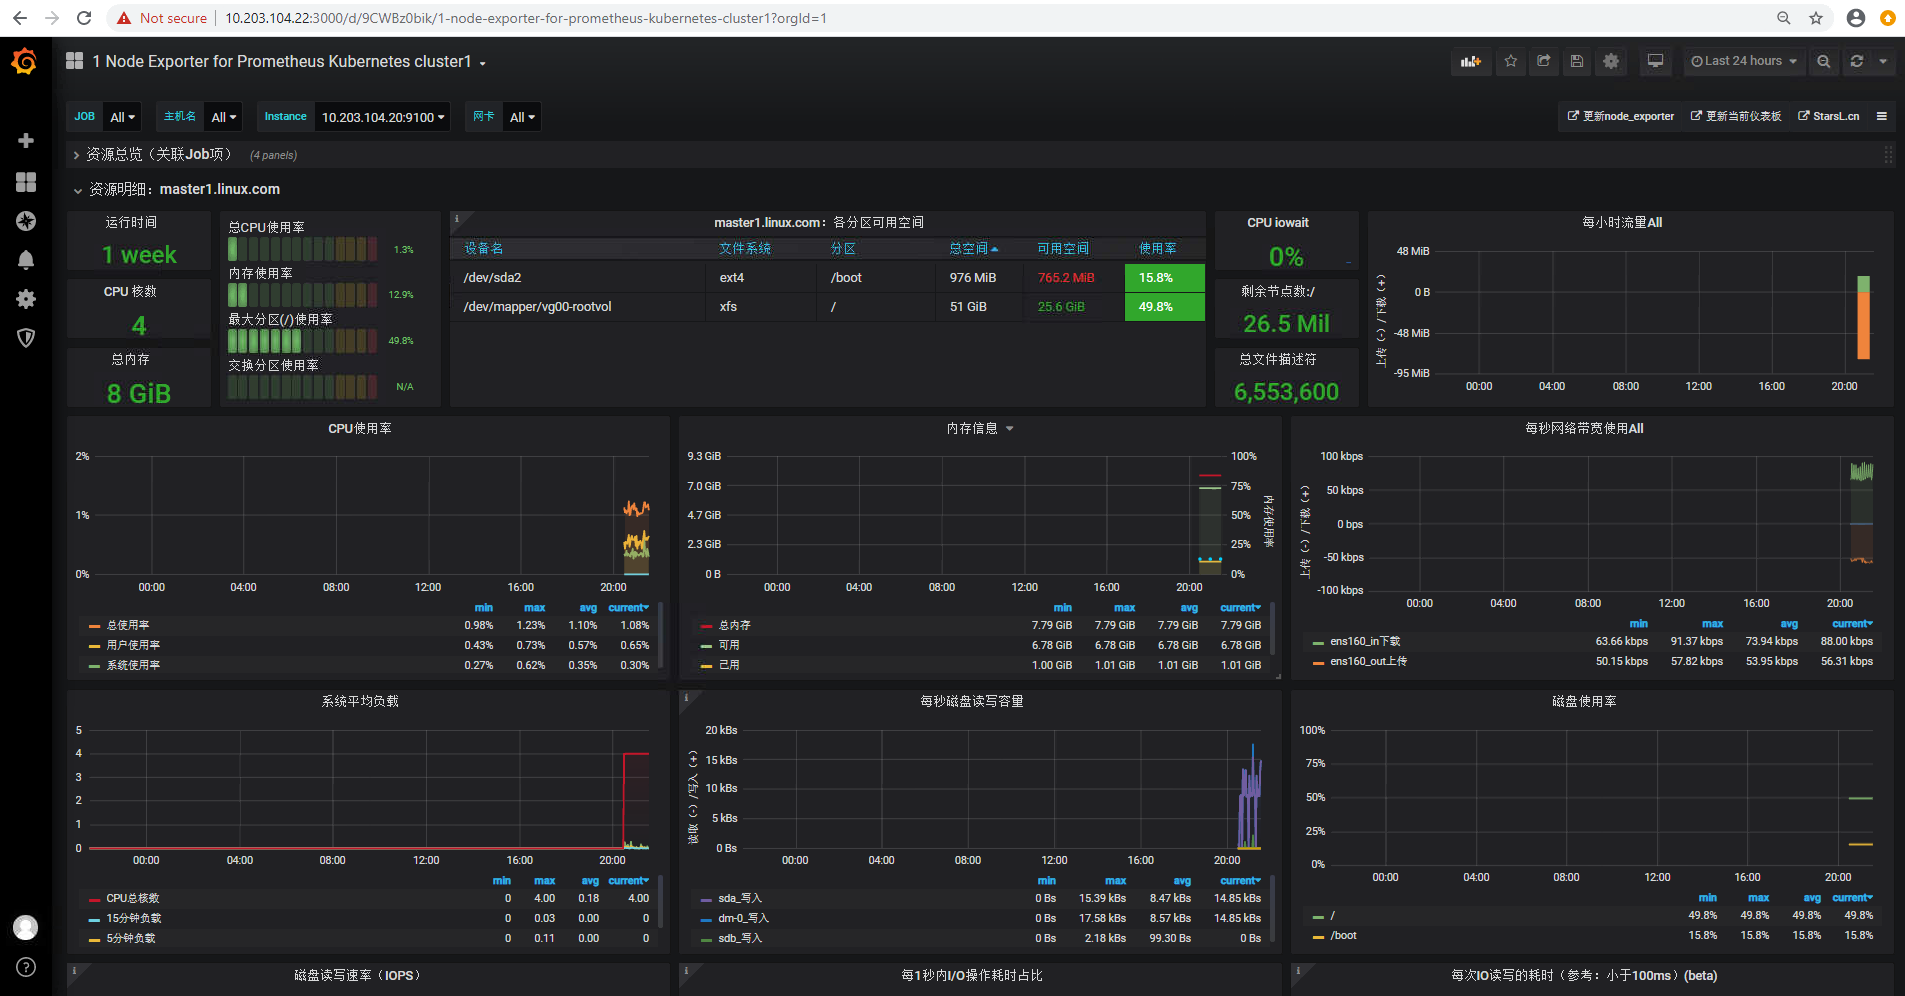
验证图形信息
饼图插件未安装,需要提前安装
https://grafana.com/grafana/plugins/grafana-piechart-panel
在线安装:
# grafana-cli plugins install grafana-piechart-panel

离线安装:
root@master3:/var/lib/grafana/plugins# pwd
/var/lib/grafana/plugins

root@master3:/var/lib/grafana/plugins# ls
grafana-piechart-panel-v1.5.0-0-g3234d63.zip

root@master3:/var/lib/grafana/plugins# unzip grafana-piechart-panel-v1.5.0-0-g3234d63.zip
root@master3:/var/lib/grafana/plugins# mv grafana-piechart-panel-3234d63/ grafana-piechart-panel
root@master3:/var/lib/grafana/plugins# systemctl restart grafana-server
监控pod资源
node节点都需安装cadvisor
cadvisor由谷歌开源,cadvisor不仅可以搜集一台机器上所有运行的容器信息,还提供基础查询界面和http接口,方便其他组件如Prometheus进行数据抓取,cAdvisor可以对节点机器上的资源及容器进行实时监控和性能数据采集,包括CPU使用情况、内存使用情况、网络吞吐量及文件系统使用情况。
k8s 1.12之前cadvisor集成在node节点的上kubelet服务中,从1.12版本开始分离为两个组件,因此需要在node节点单独部署cadvisor。
https://github.com/google/cadvisor
cadvisor镜像准备
# docker load -i cadvisor_v0.36.0.tar.gz
# docker tag gcr.io/google-containers/cadvisor:v0.36.0 harbor.linux.com/baseimages/cadvisor:v0.36.0
# docker push harbor.linux.com/baseimages/cadvisor:v0.36.0
启动cadvisor容器
# docker run
    --volume=/:/rootfs:ro
    --volume=/var/run:/var/run:rw
    --volume=/sys:/sys:ro
    --volume=/var/lib/docker/:/var/lib/docker:ro
    --volume=/dev/disk/:/dev/disk:ro
    --publish=8080:8080
    --detach=true
    --name=cadvisor
    harbor.linux.com/baseimages/cadvisor:v0.36.0
验证cadvisor web界面:
访问node节点的cadvisor监听端口:http://10.203.104.26:8080/
prometheus采集cadvisor数据
root@master2:~# cat /usr/local/prometheus/prometheus.yml
scrape_configs:
  # The job name is added as a label `job=<job_name>` to any timeseries scraped from this config.
  #- job_name: 'prometheus'

    # metrics_path defaults to '/metrics'
    # scheme defaults to 'http'.

        # static_configs:
        #- targets: ['localhost:9090']

    - job_name: 'prometheus-node'
      static_configs:
      - targets: ['10.203.104.26:9100','10.203.104.27:9100','10.203.104.28:9100']

    - job_name: 'prometheus-master'
      static_configs:
      - targets: ['10.203.104.20:9100','10.203.104.21:9100','10.203.104.22:9100']

    - job_name: 'prometheus-pod-cadvisor'
      static_configs:
      - targets: ['10.203.104.26:8080','10.203.104.27:8080','10.203.104.28:8080']
重启prometheus
root@master2:~# systemctl restart prometheus
grafana添加pod监控模板
prometheus报警设置
prometheus触发一条告警的过程:
prometheus--->触发阈值--->超出持续时间--->alertmanager--->分组|抑制|静默--->媒体类型--->邮件|钉钉|微信等。
分组(group): 将类似性质的警报合并为单个通知。
静默(silences): 是一种简单的特定时间静音的机制,例如:服务器要升级维护可以先设置这个时间段告警静默。
抑制(inhibition): 当警报发出后,停止重复发送由此警报引发的其他警报即合并一个故障引起的多个报警事件,可以消除冗余告警
- alertmanager主机的IP为10.203.104.22,主机名为master3
下载并报警组件alertmanager
root@master3:/usr/local/src# ls
alertmanager-0.20.0.linux-amd64.tar.gz  grafana_6.7.2_amd64.deb  node_exporter-0.18.1.linux-amd64.tar.gz

root@master3:/usr/local/src# tar -zxvf alertmanager-0.20.0.linux-amd64.tar.gz
alertmanager-0.20.0.linux-amd64/
alertmanager-0.20.0.linux-amd64/LICENSE
alertmanager-0.20.0.linux-amd64/alertmanager
alertmanager-0.20.0.linux-amd64/amtool
alertmanager-0.20.0.linux-amd64/NOTICE
alertmanager-0.20.0.linux-amd64/alertmanager.yml

root@master3:/usr/local/src# ln -sv /usr/local/src/alertmanager-0.20.0.linux-amd64 /usr/local/alertmanager
'/usr/local/alertmanager' -> '/usr/local/src/alertmanager-0.20.0.linux-amd64'

root@master3:/usr/local/src# cd /usr/local/alertmanager
root@master3:/usr/local/alertmanager# ls
alertmanager  alertmanager.yml  amtool  LICENSE  NOTICE
配置alertmanager
https://prometheus.io/docs/alerting/configuration/ #官方配置文档
root@master3:/usr/local/alertmanager# cat alertmanager.yml
global:
  resolve_timeout: 5m
  smtp_smarthost: 'smtp.qq.com:465'
  smtp_from: '2973707860@qq.com'
  smtp_auth_username: '2973707860@qq.com'
  smtp_auth_password: 'udwthyyxtstcdhcj'
  smtp_hello: '@qq.com'
  smtp_require_tls: false

route:
  group_by: ['alertname']
  group_wait: 10s
  group_interval: 10s
  repeat_interval: 1h
  receiver: 'web.hook'
receivers:
- name: 'web.hook'
  #webhook_configs:
  #- url: 'http://127.0.0.1:5001/'
  email_configs:
    - to: '2973707860@qq.com'
inhibit_rules:
  - source_match:
      severity: 'critical'
    target_match:
      severity: 'warning'
    equal: ['alertname', 'dev', 'instance']
启动alertmanager服务
二进制启动
root@master3:/usr/local/alertmanager# ./alertmanager --config.file=./alertmanager.yml
服务启动文件
root@master3:/usr/local/alertmanager# cat /etc/systemd/system/alertmanager.service
[Unit]
Description=Prometheus Server
Documentation=https://prometheus.io/docs/introduction/overview/
After=network.target
[Service]
Restart=on-failure
ExecStart=/usr/local/alertmanager/alertmanager --config.file=/usr/local/alertmanager/alertmanager.yml
[Install]
WantedBy=multi-user.target
启动服务
root@master3:/usr/local/alertmanager# systemctl start alertmanager.service
root@master3:/usr/local/alertmanager# systemctl enable alertmanager.service
Created symlink /etc/systemd/system/multi-user.target.wants/alertmanager.service → /etc/systemd/system/alertmanager.service.
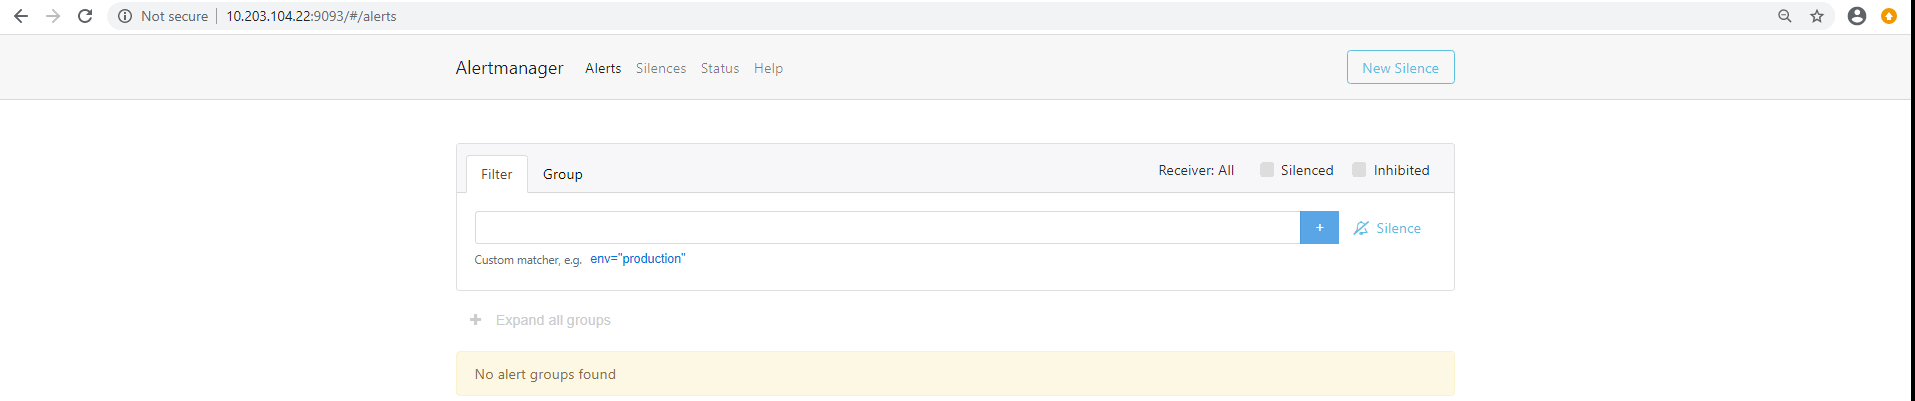
web 测试访问9093端口
配置prometheus报警规则
root@master2:/usr/local/prometheus# cat prometheus.yml
# my global config
global:
  scrape_interval:     15s # Set the scrape interval to every 15 seconds. Default is every 1 minute.
  evaluation_interval: 15s # Evaluate rules every 15 seconds. The default is every 1 minute.
  # scrape_timeout is set to the global default (10s).

# Alertmanager configuration
alerting:
  alertmanagers:
  - static_configs:
    - targets:
      - 10.203.104.22:9093   #alertmanager地址

# Load rules once and periodically evaluate them according to the global 'evaluation_interval'.
rule_files:
  - "/usr/local/prometheus/danran_rule.yml"   #指定规则文件
  # - "first_rules.yml"
  # - "second_rules.yml"
创建报警规则文件
root@master2:/usr/local/prometheus# cat danran_rule.yml
groups:
  - name: danran_pod.rules
    rules:
    - alert: Pod_all_cpu_usage
      expr: (sum by(name)(rate(container_cpu_usage_seconds_total{image!=""}[5m]))*100) > 75
      for: 5m
      labels:
        severity: critical
        service: pods
      annotations:
        description: 容器 {{ $labels.name }} CPU 资源利用率大于 75% , (current value is {{ $value }})
        summary: Dev CPU 负载告警

    - alert: Pod_all_memory_usage
      expr: sort_desc(avg by(name)(irate(container_memory_usage_bytes{name!=""}[5m]))*100) > 1024*10^3*2
      for: 10m
      labels:
        severity: critical
      annotations:
        description: 容器 {{ $labels.name }} Memory 资源利用率大于 2G , (current value is {{ $value }})
        summary: Dev Memory 负载告警

    - alert: Pod_all_network_receive_usage
      expr: sum by (name)(irate(container_network_receive_bytes_total{container_name="POD"}[1m])) > 1024*1024*50
      for: 10m
      labels:
        severity: critical
      annotations:
        description: 容器 {{ $labels.name }} network_receive 资源利用率大于 50M , (current value is {{ $value }})
报警规则验证
root@master2:/usr/local/prometheus# ./promtool check rules danran_rule.yml
Checking danran_rule.yml
  SUCCESS: 3 rules found
重启prometheus
root@master2:/usr/local/prometheus# systemctl restart prometheus
验证报警规则匹配
10.203.104.22为alertmanager主机
root@master3:/usr/local/alertmanager# ./amtool alert --alertmanager.url=http://10.203.104.22:9093
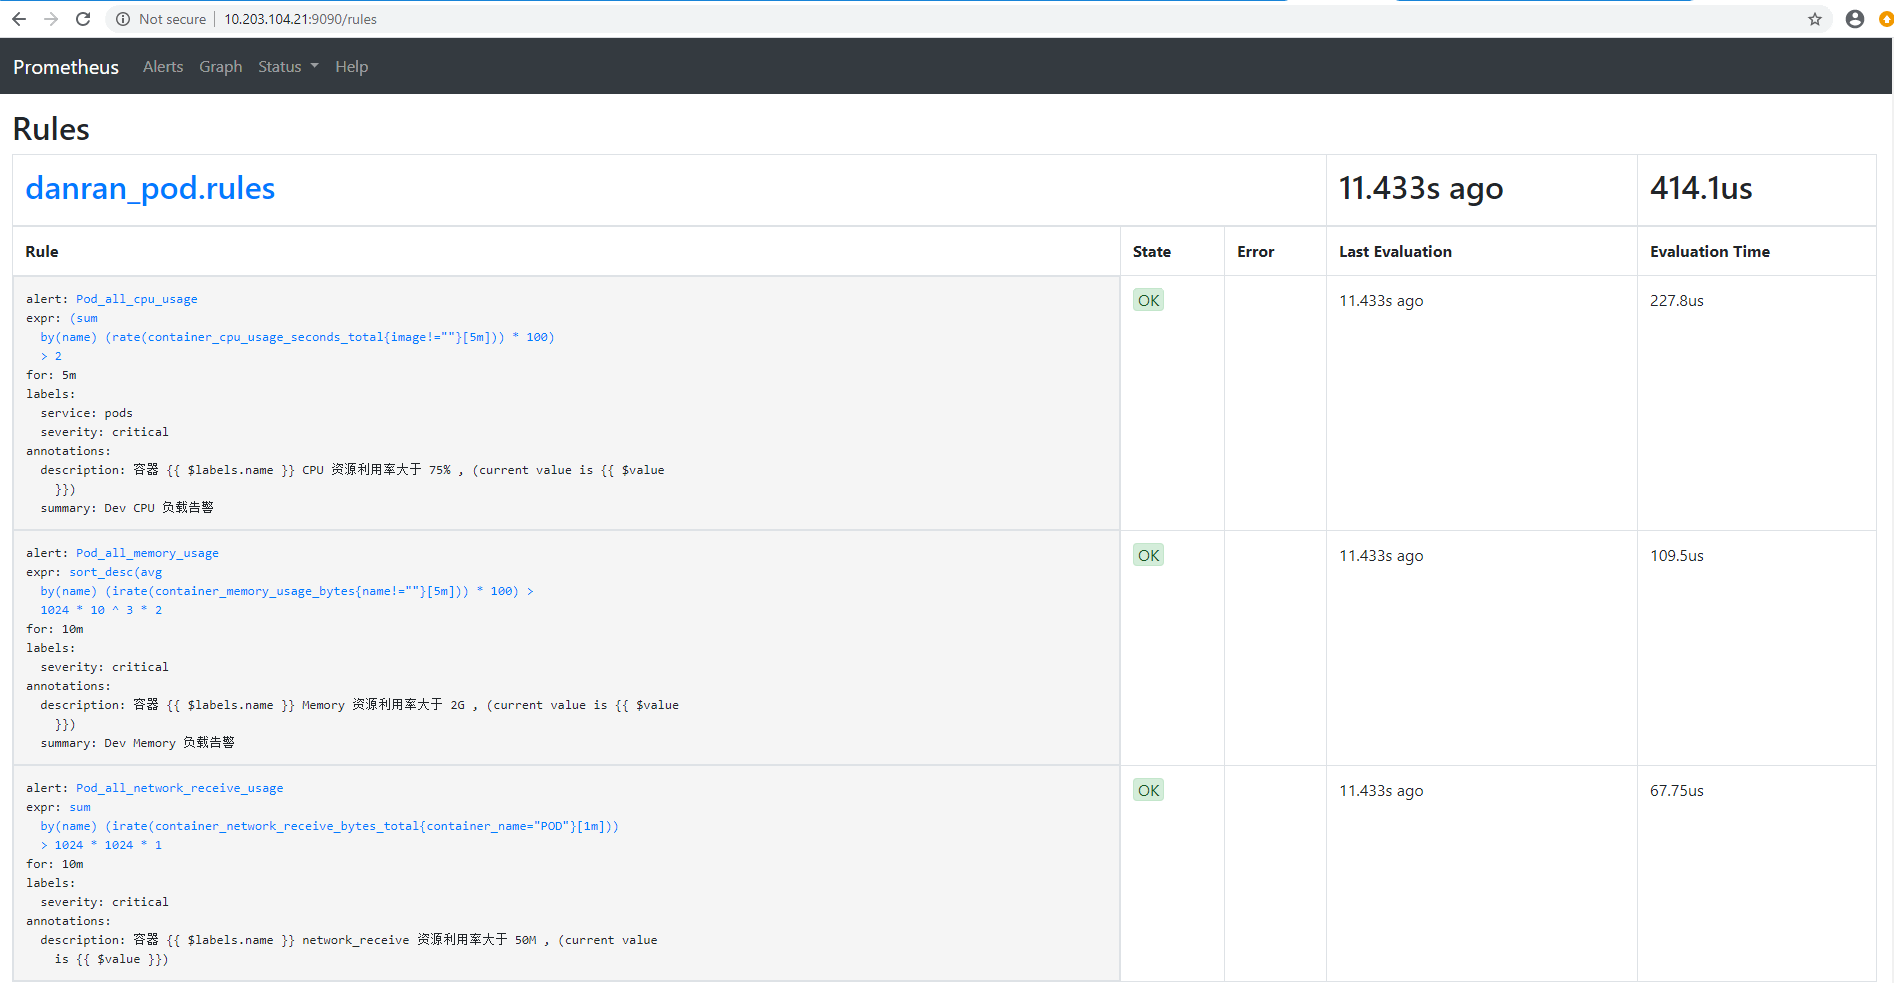
prometheus首页状态
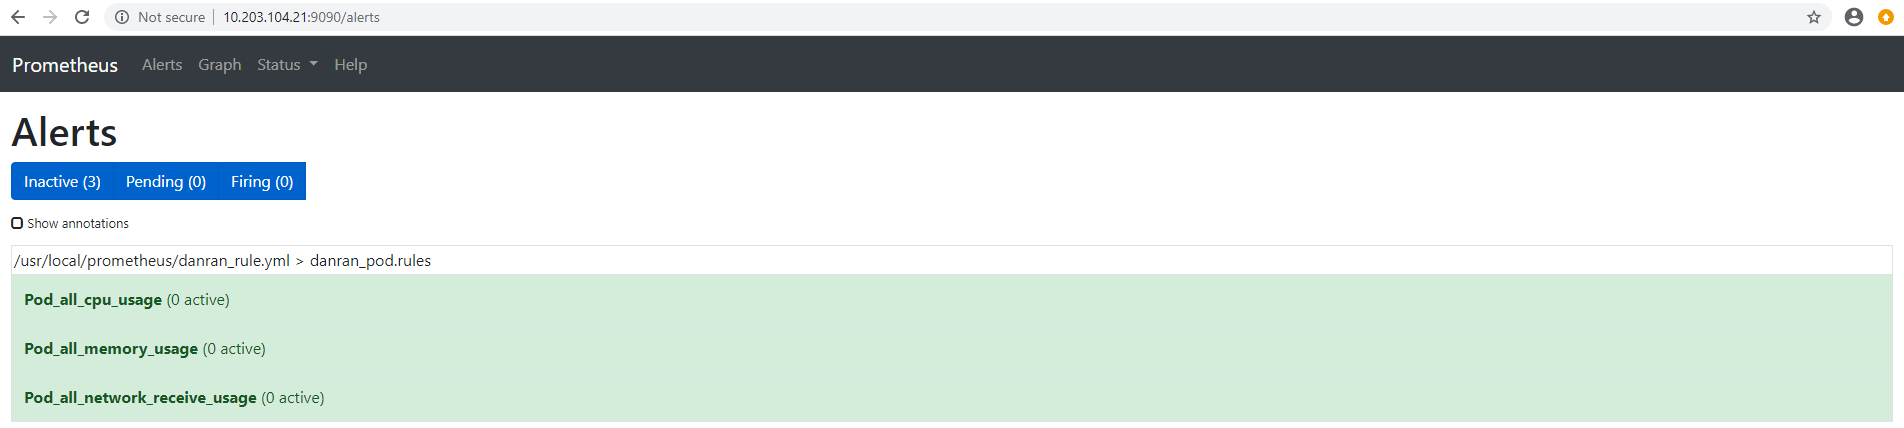
prometheus web界面验证报警规则
prometheus监控haproxy
haproxy_exporter安装在HA1(10.203.104.30)节点上
部署haproxy_exporter
root@ha1:/usr/local/src# ls
haproxy_exporter-0.10.0.linux-amd64.tar.gz
root@ha1:/usr/local/src# tar -zxvf haproxy_exporter-0.10.0.linux-amd64.tar.gz
haproxy_exporter-0.10.0.linux-amd64/
haproxy_exporter-0.10.0.linux-amd64/LICENSE
haproxy_exporter-0.10.0.linux-amd64/NOTICE
haproxy_exporter-0.10.0.linux-amd64/haproxy_exporter

root@ha1:/usr/local/src# ln -sv /usr/local/src/haproxy_exporter-0.10.0.linux-amd64 /usr/local/haproxy_exporter
'/usr/local/haproxy_exporter' -> '/usr/local/src/haproxy_exporter-0.10.0.linux-amd64'
root@ha1:/usr/local/src# cd /usr/local/haproxy_exporter
启动haproxy_exporter
root@ha1:/usr/local/haproxy_exporter# ./haproxy_exporter  --haproxy.scrape-uri=unix:/run/haproxy/admin.sock
或指定haproxy的状态页启动
root@ha1:/usr/local/haproxy_exporter# ./haproxy_exporter --haproxy.scrape-uri="http://haadmin:danran@10.203.104.30:9999/haproxy-status;csv"

查看haproxy的状态页配置
root@ha1:/usr/local/src# cat /etc/haproxy/haproxy.cfg
listen stats
    mode http
    bind 0.0.0.0:9999
    stats enable
    log global
    stats uri /haproxy-status
    stats auth haadmin:danran
编辑启动脚本
root@ha1:~# cat /etc/systemd/system/haproxy-exporter.service
[Unit]
Description=Prometheus Haproxy Exporter
After=network.target

[Service]
ExecStart=/usr/local/haproxy_exporter/haproxy_exporter  --haproxy.scrape-uri=unix:/run/haproxy/admin.sock


[Install]
WantedBy=multi-user.target

root@ha1:~# systemctl restart haproxy-exporter.service
验证web界面数据

prometheus server端添加haproxy数据采集
root@master2:/usr/local/prometheus# cat prometheus.yml
scrape_configs:
  # The job name is added as a label `job=<job_name>` to any timeseries scraped from this config.
  #- job_name: 'prometheus'

    # metrics_path defaults to '/metrics'
    # scheme defaults to 'http'.

        # static_configs:
        #- targets: ['localhost:9090']

- job_name: 'prometheus-node'
  static_configs:
  - targets: ['10.203.104.26:9100','10.203.104.27:9100','10.203.104.28:9100']

- job_name: 'prometheus-master'
  static_configs:
  - targets: ['10.203.104.20:9100','10.203.104.21:9100','10.203.104.22:9100']

- job_name: 'prometheus-pod'
  static_configs:
  - targets: ['10.203.104.26:8080','10.203.104.27:8080','10.203.104.28:8080']

- job_name: 'prometheus-haproxy'
  static_configs:
  - targets: ['10.203.104.30:9101']
重启prometheus
root@master2~# systemctl restart prometheus
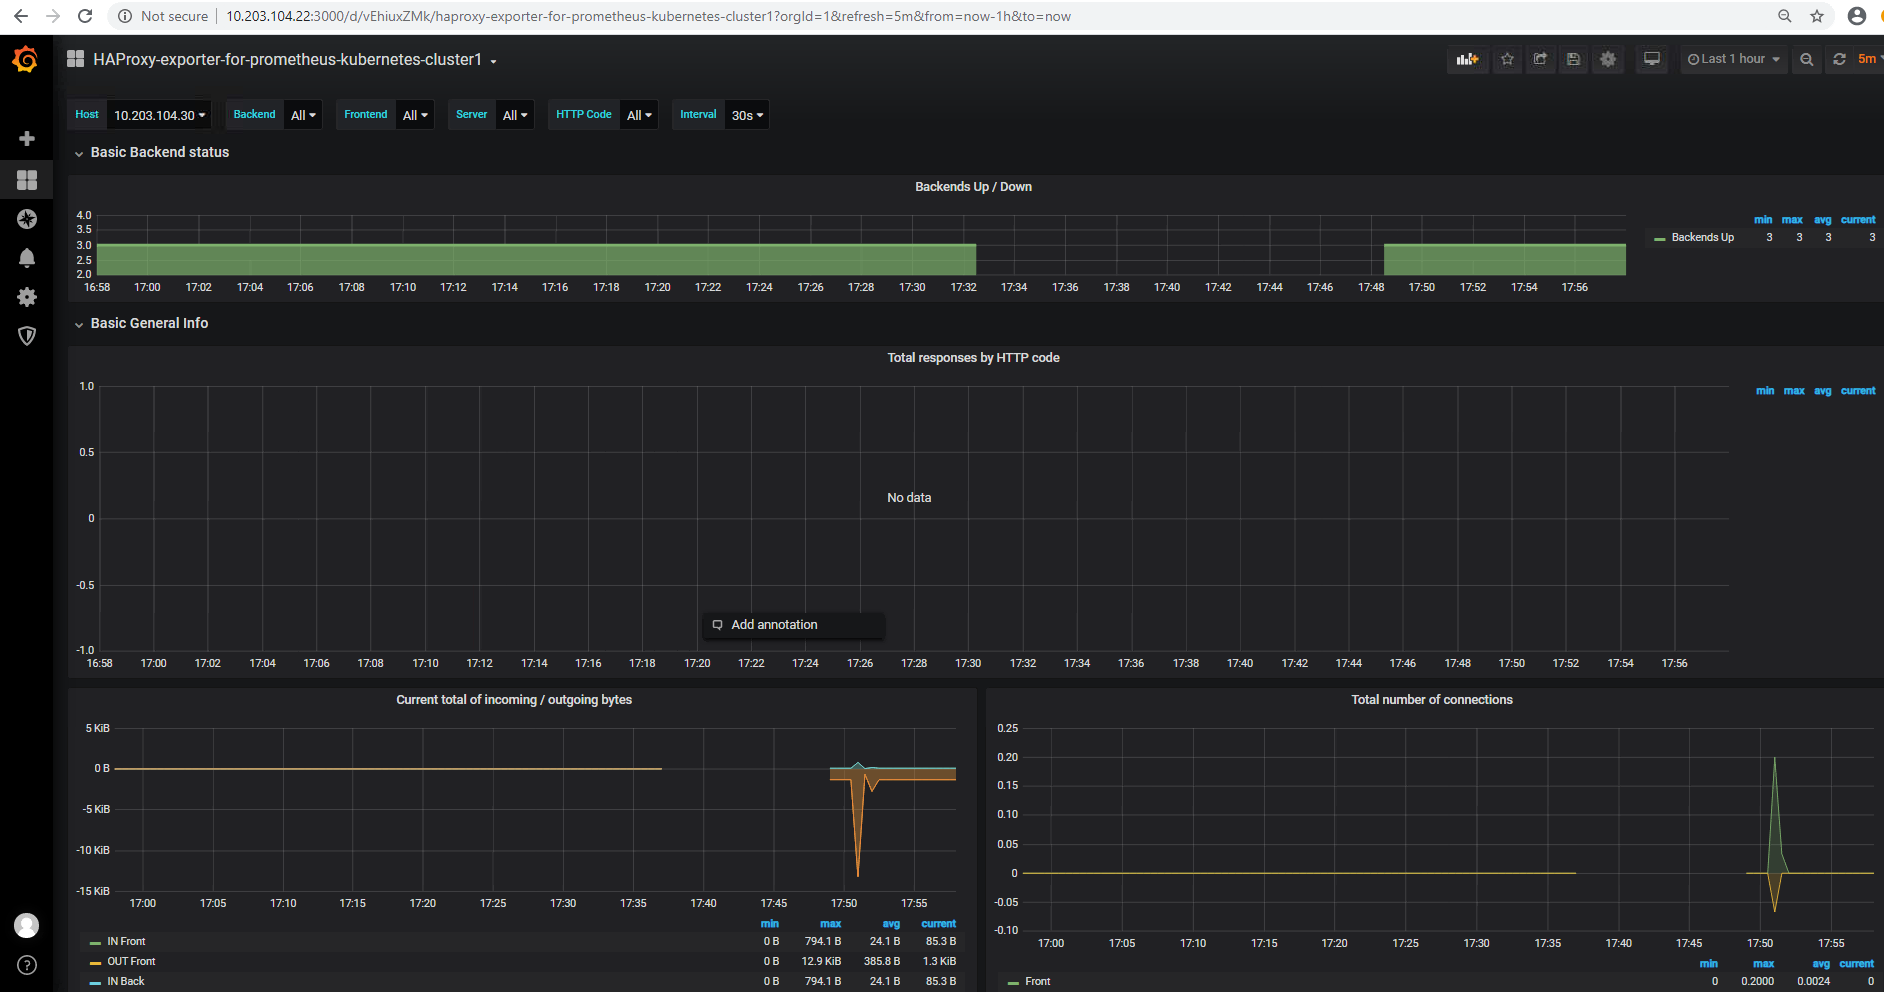
grafana添加数据模板
获取模板
https://grafana.com/grafana/dashboards?dataSource=prometheus&direction=asc&orderBy=name&search=haproxy
在grafana中import 导入下载模版ID或JSON文件

验证haproxy监控数据