项目要求,现需要一个能根据Excel的坐标数据,在图像上进行描点连线,并且连线的方式是以所有的点进行最大轮廓连线。现在实现了要求,但是由于代码写得太乱,我只是简单的说一下实现算法就好了,代码也会贴出来,时间过于久,我也有些地方忘记了,但是整体算法还是记得的~
下面开始简单的说一下:
首先,所有点的坐标数据就像下图所示:
问题:如何将所有的点以最大的轮廓连线呢??
思路:应该是数学问题,如何将坐标列表重新排序成以最大轮廓的坐标列表,因为matplotlib库可以根据一个列表里面的坐标数据直接生成连线。
我的排序算法是:
1.首先,将所有坐标进行排序,可以以x排序,然后找到最左边的坐标点和最右边的坐标;
2.以最左边和最右边的坐标进行求解方程,两点确定一条直线,就是求该直线的方程;
3.将剩余的所有坐标x代入步骤2的方程组,求出解和坐标y进行比较,将线下方的点和上方的点坐标分别求出来,然后存入一个列表备份;
4.将下方坐标的列表进行排序,由小到大,然后存入一个最终列表中,最终列表第一个肯定是最左边的点,然后就是下方的点;
5.将下方坐标的列表进行排序,由大到小,然后继续分别存入最终列表,最后在最终列表中在加上最左边的坐标点,使连线闭合;
6.然后用matplotlib里面的pyplot函数,将最终列表连线即可。
上面的算法我写在了一个函数里面,这是非常不对的,但是如今还是不想将其整理出来,哈哈,思维不乱就行~~


  1         try:
  2             # 先提取成一个个位置坐标
  3             coordinate = []
  4             for i in range(len(x)):
  5                 coordinate.append([x[i], y[i]])
  6
  7             # print(coordinate)
  8
  9             # 这是基准列表,x最小最大,y最小最大
 10             sort_list = []
 11             # 剩下的坐标数据
 12             ret_list = []
 13             # 下方的点数据
 14             under_list = []
 15             # 总的排序结果
 16             final_list = []
 17             # 临时列表
 18             temp = []
 19
 20             # 下方的点
 21             down_dot = []
 22             # 上方的点
 23             up_dot = []
 24
 25             y_max_and_y_min = []
 26
 27             # 进行x排序
 28             sort_x(coordinate)
 29
 30             # 排序完成肯定是第一个最小,最后一个最大,将这两个数据添加到确定的基准列表里面
 31             sort_list.append(coordinate[0])
 32             sort_list.append(coordinate[len(coordinate) - 1])
 33
 34             # 这下面进行以y大小进行排序,,重新存储在一个新列表里面
 35             sort_y(coordinate)
 36             y_max_and_y_min.append(coordinate[0])
 37             y_max_and_y_min.append(coordinate[len(coordinate) - 1])
 38
 39             # 这句代码实现的功能是和基准列表进行比对,求除了基准列表剩下的所有坐标数据
 40             ret_list = [item for item in coordinate if item not in sort_list] + [item for item in sort_list if
 41                                                                                  item not in coordinate]
 42
 43             print("确定的坐标:" + str(sort_list))
 44
 45             print("剩余的坐标: " + str(ret_list))
 46
 47             # 最左坐标
 48             left_x = sort_list[0][0]
 49             left_y = sort_list[0][1]
 50
 51             # 最右坐标
 52             right_x = sort_list[1][0]
 53             right_y = sort_list[1][1]
 54
 55             # 最下坐标
 56             down_x = y_max_and_y_min[0][0]
 57             down_y = y_max_and_y_min[0][1]
 58
 59             # 最上坐标
 60             up_x = y_max_and_y_min[1][0]
 61             up_y = y_max_and_y_min[1][1]
 62
 63             # 实现两点之间的公式
 64             # y = k*x + b
 65
 66             # 总判断公式,,蛮重要
 67             k = (right_y - left_y) / (right_x - left_x)
 68             b = left_y - k * left_x
 69
 70             print("y=" + str(k) + "x" + '+' + str(b))
 71
 72             # 开始进行比对,判断剩余列表里面的每一个点,如果在直线下方,就加入下方列表里面
 73             for i in range(len(ret_list)):
 74                 # print(ret_list[i])
 75                 if (under(k, b, ret_list[i])):
 76                     under_list.append(ret_list[i])
 77
 78             print("下面列表的数据", under_list)
 79
 80             # 对下方列表再以x为基准进行排序
 81             under_list = sort_x(under_list)
 82
 83             # 排序完成直接都添加到确定的列表里面,先添加一个最左的坐标,在循环结束之后再添加最右的数据
 84             final_list.append(sort_list[0])
 85
 86             for t in under_list:
 87                 final_list.append(t)
 88                 # 边添加还边让数据从剩余列表里面去掉
 89                 ret_list.remove(t)
 90
 91             final_list.append(sort_list[1])
 92
 93             ################################################################################
 94             # 到此,,下方的排序已经结束
 95             print(final_list)
 96             num_under = len(final_list)
 97
 98             print(ret_list)
 99
100             # 剩下的列表进行冒泡排序,还是由小到大,但是最后翻转一下列表就可以
101             ret_list = sort_x(ret_list)
102             ret_list = (list(reversed(ret_list)))
103
104             print(ret_list)
105
106             for t in ret_list:
107                 """将剩下的坐标添加到处理后的列表里面"""
108                 final_list.append(t)
109
110             # 这个是再补一个坐标,使曲线闭合
111             final_list.append(sort_list[0])
112
113             print(ret_list)
114             print("最终列表-----------", final_list)
115
116             # 分离后的x,y坐标数据
117             final_x = []
118             final_y = []
119
120             for i in range(len(final_list)):
121                 """将坐标数据从新分离成两个列表"""
122                 final_x.append(final_list[i][0])
123                 final_y.append(final_list[i][1])
124
125             # print(final_x)
126             # print(final_y)
127
128             # 在这需要将列表翻装一下,调试好久才发现
129             final_list = list(reversed(final_list))
130
131             # 将图像显示出来
132             # showResult(final_x, final_y,'title', 'x', 'y')
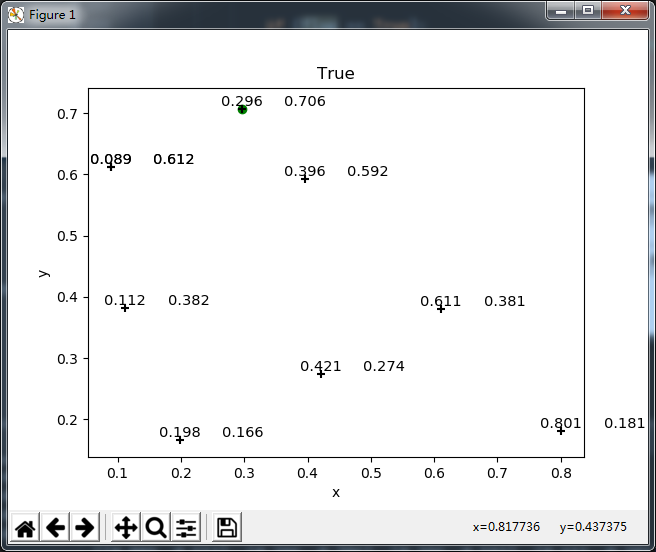
连线起来的最终效果图:

项目要求2: 判断一个点是否在所围的轮廓内。
实现方法:
1.首先判断是否在x坐标是否在最左,最右之间,y坐标是否在最上,最下坐标之间,如果不在,直接判定不在;
2.判断是否为原来数据的点,如果是直接判定在轮廓内;
3.然后将需要判断的坐标代入最左最右组成的方程上,判断该坐标是该直线的上方还是下方。
4.若在下方,判断在下方的坐标点哪两个坐标之间,根据左右两个坐标点进行直线方程的求解,然后将需判断坐标的x代入,求解是否大于y坐标,如果大于就判定是在轮廓里面;
5.若在上方,判定条件改成小于才在轮廓里面;
代码如下:
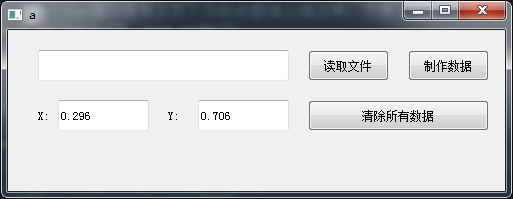
# 下面进行判断一个点是否在圈内
            # x_judge = 0.396
            # y_judge = 0.592

            x_get = self.input_x.text()
            y_get = self.input_y.text()

            if (len(x_get)==0):
                QMessageBox.critical(self, 'reslult', '请输入x,y')
                x_judge = final_x[0]
                y_judge = final_y[0]
                judge = [float(x_judge), float(y_judge)]
                self.input_x.setText(str(x_judge))
                self.input_y.setText(str(y_judge))
            else:
                x_judge = float(x_get)
                y_judge = float(y_get)

                judge = [float(x_judge), float(y_judge)]

            if judge == sort_list[0] or judge == sort_list[1] or judge == y_max_and_y_min[0] or judge ==
                    y_max_and_y_min[1]:
                """先判断是否是基准点"""
                print("在--相等")
                flag=True
                QMessageBox.critical(self,'reslult' , 'in')
            elif is_midle(judge[0], left_x, right_x) and is_midle(judge[1], down_y, up_y):
                """先判断是否在大圈之内"""
                # 先判断是在上方的点还是上方的点,如果在下方用下方的公式,否则,相反
                if not under(k, b, judge):
                    print("在下方")
                    for i in range(len(down_dot) - 1):
                        if is_midle(judge[0], down_dot[i][0], down_dot[i + 1][0]):
                            # print(down_dot[i][0],down_dot[i+1][0])
                            print(down_dot[i], down_dot[i + 1])
                            k_test, b_test = generate_equation(down_dot[i], down_dot[i + 1])
                            print(k_test, b_test)
                            if not (under(k_test, b_test, judge)):
                                print("不在")
                                flag = False
                                QMessageBox.critical(self,'reslult' , 'not in')
                                break
                            else:
                                print("在")
                                flag = True
                                QMessageBox.critical(self, 'reslult' ,'in')
                                break
                        else:
                            pass
                elif not up_under(k, b, judge):
                    print("在上方")
                    for i in range(len(up_dot) - 1):
                        if is_midle(judge[0], up_dot[i + 1][0], up_dot[i][0]):
                            print(up_dot[i], up_dot[i + 1])
                            k_test, b_test = generate_equation(up_dot[i], up_dot[i + 1])
                            print(k_test, b_test)
                            if (up_under(k_test, b_test, judge)):
                                print("在")
                                flag = True
                                QMessageBox.critical(self, 'reslult' ,'in')
                                break
                            else:
                                print("不在")
                                flag=False
                                QMessageBox.critical(self,'reslult' , 'not in')
                                break
                        else:
                            pass

            else:
                print("不在")
                flag = False
                QMessageBox.critical(self,'reslult' ,'not in')


            if (flag == True):
                plt.scatter(x_judge, y_judge, color='green', marker='o')
            elif (flag == False):
                plt.scatter(x_judge,y_judge,color='red',marker='o')

            plt.plot(final_x, final_y, color='black', linewidth=2.0)
            plt.scatter(final_x, final_y, color='black', marker='+')
            plt.title(str(flag))
            plt.xlabel('x')
            plt.ylabel('y')
            for x1, y1 in zip(final_x, final_y):
                plt.text(x1,y1, str(x1), ha='center', va='bottom', fontsize=10.5)
            for x2, y2 in zip(final_x, final_y):
                plt.text(x2+0.1,y2, str(y2), ha='center', va='bottom', fontsize=10.5)


            plt.show()
至此,项目的要求算为完成,然后组成了GUI界面,所用的库是PYQT5。其实这个库真的挺好用的。
说下打包成exe 的时候遇到的问题,最新版的matplotlib库用pyinstaller根据打包不成功,如果按照网上的说法一个个依赖去寻找,太过于麻烦,
我查了半天资料,发现有个大佬说旧版的matplotlib可以,我连忙卸载新版的,下载旧版的,打包,,成功。就很完美~~~
至此,项目结束。
完成代码我放在了我的网盘上,有点点乱~下面是网盘链接:
https://wws.lanzous.com/i7xTKiz7o7g