zabbix监控nginx,nginx需要添加--with-http_stub_status模块
使用zabbix监控nginx,首先nginx需要配置开启ngx_status。但是我这边nginx安装成功了并且也没有添加sub模块,需要重新编译添加该模块。配置如下:
# 在添加之前需要查看是否有sub的模块(--with-http_sub_module 这个模块),如果没有就需要重新编译
# 使用nginx -V可以查看
[root@VM_0_10_centos thy]# /usr/local/nginx/sbin/nginx -V
nginx version: nginx/1.16.1
built by gcc 4.8.5 20150623 (Red Hat 4.8.5-39) (GCC)
built with OpenSSL 1.0.2k-fips  26 Jan 2017
TLS SNI support enabled
configure arguments: --prefix=/usr/local/nginx --pid-path=/var/run/nginx/nginx.pid --lock-path=/var/lock/nginx.lock --er
ror-log-path=/var/log/nginx/error.log --http-log-path=/var/log/nginx/access.log --with-http_gzip_static_module --http-client-body-temp-path=/var/tmp/nginx/client --http-proxy-temp-path=/var/tmp/nginx/proxy --http-fastcgi-temp-path=/var/tmp/nginx/fastcgi --http-uwsgi-temp-path=/var/tmp/nginx/uwsgi --http-scgi-temp-path=/var/tmp/nginx/scgi --with-http_ssl_module

# 重新配置(需要在nginx的解压目录下执行)
./configure
--prefix=/usr/local/nginx
--pid-path=/var/run/nginx/nginx.pid
--lock-path=/var/lock/nginx.lock
--error-log-path=/var/log/nginx/error.log
--http-log-path=/var/log/nginx/access.log
--with-http_gzip_static_module
--http-client-body-temp-path=/var/tmp/nginx/client
--http-proxy-temp-path=/var/tmp/nginx/proxy
--http-fastcgi-temp-path=/var/tmp/nginx/fastcgi
--http-uwsgi-temp-path=/var/tmp/nginx/uwsgi
--http-scgi-temp-path=/var/tmp/nginx/scgi
--with-http_stub_status_module
--with-http_ssl_module
--with-http_realip_module

# 编译,注意不要make install,不然会覆盖之前的安装
[root@VM_0_10_centos nginx-1.16.1]# make

# 替换二进制文件(可以先备份好再操作)(如果没有这一步,就不会重新加载模块,使用-V查看的还会是之前的模块)
[root@VM_0_10_centos nginx-1.16.1]# cp /usr/local/src/nginx-1.16.1/objs/nginx /usr/local/nginx/sbin/

# 重启nginx(nginx停掉重启,pid文件会被删除,所以需要生成下pid文件再重启),再次-V查看就能看到刚刚添加的模块
[root@VM_0_10_centos nginx-1.16.1]# /usr/local/nginx/sbin/nginx -t
[root@VM_0_10_centos nginx-1.16.1]# /usr/local/nginx/sbin/nginx -c /usr/local/nginx/conf/nginx.conf
[root@VM_0_10_centos nginx-1.16.1]# /usr/local/nginx/sbin/nginx -s reload

# 查看
[root@VM_0_10_centos nginx-1.16.1]# nginx -V
nginx version: nginx/1.16.1
built by gcc 4.8.5 20150623 (Red Hat 4.8.5-39) (GCC)
built with OpenSSL 1.0.2k-fips  26 Jan 2017
TLS SNI support enabled
configure arguments: --prefix=/usr/local/nginx --pid-path=/var/run/nginx/nginx.pid --lock-path=/var/lock/nginx.lock --er
ror-log-path=/var/log/nginx/error.log --http-log-path=/var/log/nginx/access.log --with-http_gzip_static_module --http-client-body-temp-path=/var/tmp/nginx/client --http-proxy-temp-path=/var/tmp/nginx/proxy --http-fastcgi-temp-path=/var/tmp/nginx/fastcgi --http-uwsgi-temp-path=/var/tmp/nginx/uwsgi --http-scgi-temp-path=/var/tmp/nginx/scgi --with-http_stub_status_module --with-http_ssl_module --with-http_realip_module

# 我的nginx配置文件是采用的导入方式,也就是将配置文件分开,一个主配置文件里边调用多个服务的配置文件,这里以other.conf为列开启nginx的status
[root@VM_0_10_centos thy]# pwd
/usr/local/nginx/conf/thy
[root@VM_0_10_centos thy]# vim other.conf
server{
        listen 80;
        server_name ip地址或域名;
        location / {
                root html;
        index index.html index.htm index.php;
        }
        # 开启status
    location /nginx_status {
                stub_status on;
                access_log   off;
            allow 10.0.0.1;
        allow 10.0.0.2;
        deny all;
    }

   # 缓存php生成页面内容,8个16k
   # fastcgi_buffers 8 16k;
   # 缓存php生成的头部信息
   # fastcgi_buffers_size 32k;
   # 连接php的超时时间
   # fastcgi_connect_timeout 300;
   # 发送请求的超时时间
   # fastcgi_send_timeout 300;
   # 读取请求的超时时间
   # fastcgi_read_timeout 300;

      location ~ .php$ {
          root           html;
          fastcgi_pass   127.0.0.1:9000;
          fastcgi_index  index.php;
          #fastcgi_param  SCRIPT_FILENAME  /scripts$fastcgi_script_name;
          fastcgi_param  SCRIPT_FILENAME  $document_root$fastcgi_script_name;
          include        fastcgi_params;
      }
}

# 重启nginx
[root@VM_0_10_centos thy]# /usr/local/nginx/sbin/nginx -s reload
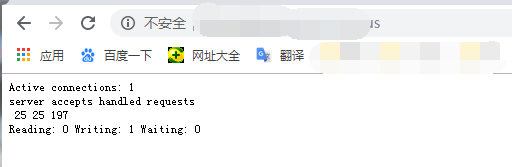
使用浏览器访问或curl访问:
[root@VM_0_10_centos thy]# curl http://ip地址或域名:80/nginx_status
Active connections: 7
server accepts handled requests
 22 22 161
Reading: 0 Writing: 1 Waiting: 6
PS:上面如果设置了允许访问的ip,那么只能在允许访问的ip访问,一般是不会开放给所有人访问的。
禁止访问会出现如下图:

active connections – 活跃的连接数量(当前与http建立的连接数,包括等待的客户端连接)7
server accepts handled requests — 接受的客户端连接总数目22 , 处理的客户端连接总数目22, 客户端总的请求数目161
reading — 读取客户端的连接数.(当前,nginx读请求连接)
writing — 响应数据到客户端的数量
waiting — 开启 keep-alive 的情况下,这个值等于 active – (reading+writing), 意思就是 Nginx 已经处理完正在等候下一次请求指令的驻留连接.(目前有多少空闲客户端请求连接)
zabbix配置
上面配置好stub模块之后,现在配置zabbix监控nginx的服务。我们除了监控以上数据,还需要监控nginx进程状态,并且配置触发器!
1. zabbix客户端配置
# 在zabbix_agentd客户端编写监控脚本
[root@VM_0_10_centos thy]# cd /usr/local/share/zabbix/alertscripts/
[root@VM_0_10_centos alertscripts]# vi ngx_status.sh
#!/bin/bash
# DateTime: 2019-12-10
# AUTHOR: HeiDi
# Description: Zabbix monitors nginx performance and process status

# 开启stub_status服务的名称,也就ip或域名
HOST="ip或域名"
PORT="80"

# Detects if the nginx process exists
function ping {
    /sbin/pidof nginx | wc -l
}

# check nginx property
# 这中方法也可以实现和下面相同的效果curl http://域名/nginx_status 2>/dev/null | grep Active | awk -F '[:]+' '{p
rint $2}'  这里的[:]+表示以1个或多个 :(空格或冒号)作为分隔符
# NR表示行,
function active {
    /usr/bin/curl "http://$HOST:$PORT/nginx_status/" 2>/dev/null| grep 'Active' | awk '{print $NF}'
}
function reading {
    /usr/bin/curl "http://$HOST:$PORT/nginx_status/" 2>/dev/null| grep 'Reading' | awk '{print $2}'
}
function writing {
    /usr/bin/curl "http://$HOST:$PORT/nginx_status/" 2>/dev/null| grep 'Writing' | awk '{print $4}'
}
function waiting {
    /usr/bin/curl "http://$HOST:$PORT/nginx_status/" 2>/dev/null| grep 'Waiting' | awk '{print $6}'
}
function accepts {
    /usr/bin/curl "http://$HOST:$PORT/nginx_status/" 2>/dev/null| awk NR==3 | awk '{print $1}'
}
function handled {
    /usr/bin/curl "http://$HOST:$PORT/nginx_status/" 2>/dev/null| awk NR==3 | awk '{print $2}'
}
function requests {
    /usr/bin/curl "http://$HOST:$PORT/nginx_status/" 2>/dev/null| awk NR==3 | awk '{print $3}'
}

# execute function
$1

# 赋予权限
[root@VM_0_10_centos alertscripts]# chmod +x ngx_status.sh
[root@VM_0_10_centos alertscripts]# chown zabbix.zabbix ngx_status.sh
本地服务器上测试:
[root@VM_0_10_centos alertscripts]# ./ngx_status.sh active
5

2. 配置zabbix.conf,定义监控脚本key:
# 开启该参数,默认为0(另外还需要将zabbix_agentd.conf需要加载zabbix_agentd.conf.d目录的行注释去掉)
[root@VM_0_10_centos alertscripts]# cat /usr/local/etc/zabbix_agentd.conf | grep UnsafeUserParameter
### Option: UnsafeUserParameters
UnsafeUserParameters=1
# 加载配置文件目录
Include=/usr/local/etc/zabbix_agentd.conf.d/
# 在/usr/local/etc/zabbix_agentd.conf.d目录下添加监控项配置文件键值 [root@VM_0_10_centos alertscripts]# cd /usr/local/etc/zabbix_agentd.conf.d/ # 这里为键值,nginx_status为agentd.conf.d目录下的文件对应,后面值为nginx_status.sh脚本路径 [root@VM_0_10_centos zabbix_agentd.conf.d]# vi nginx_status UserParameter=nginx_status[*],/usr/local/share/zabbix/alertscripts/ngx_status.sh $1 # 配置好之后重启zabbix_agentd [root@VM_0_10_centos zabbix_agentd.conf.d]# killall zabbix_agentd [root@VM_0_10_centos zabbix_agentd.conf.d]# zabbix_agentd [root@VM_0_10_centos zabbix_agentd.conf.d]# ss -tulpn | grep zabbix_agentd
3. zabbix_server服务端通过zabbix_get测试获取数据
# zabbix_get -s 监控主机 -k key名
[root@VM_0_10_centos zabbix_agentd.conf.d]# zabbix_get -s 被监控agentd主机ip -k nginx_status[active]
5
PS:服务端获取数据正确之后,在web页面进行配置
4. web页面配置监控nginx操作
1)添加主机,这里我已经添加了,就不在重复操作
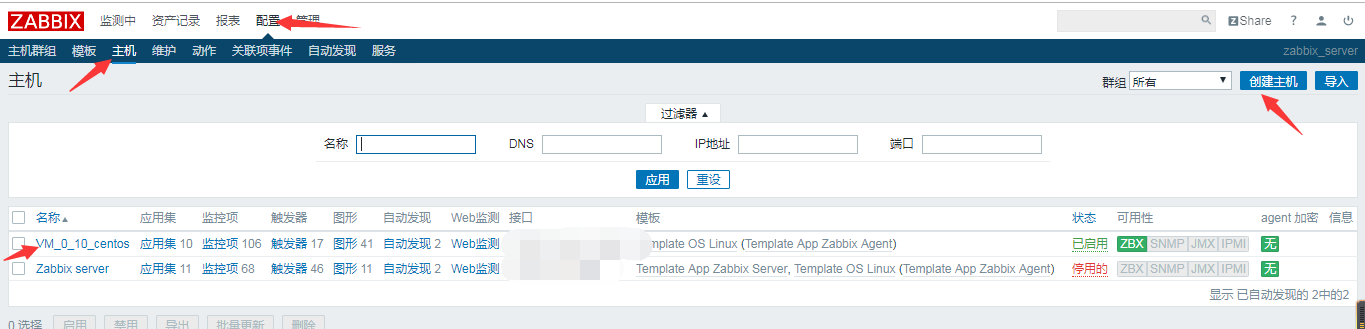
2)添加监控模板
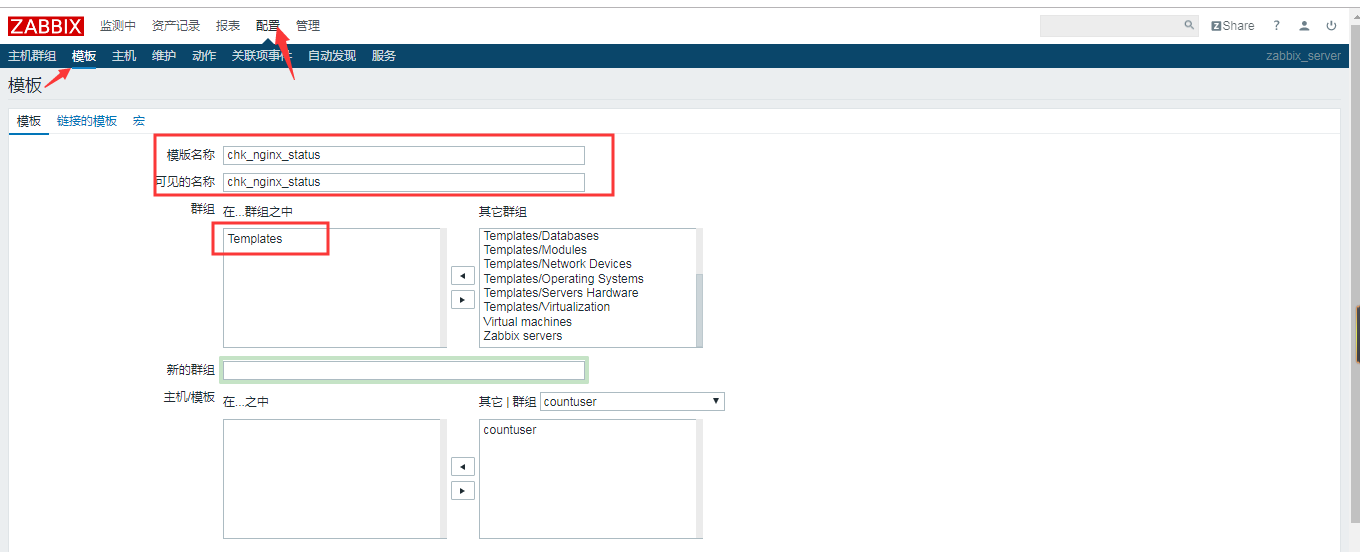
配置==》模板 ==》创建模板

填写对应的信息,确认无误点击更新
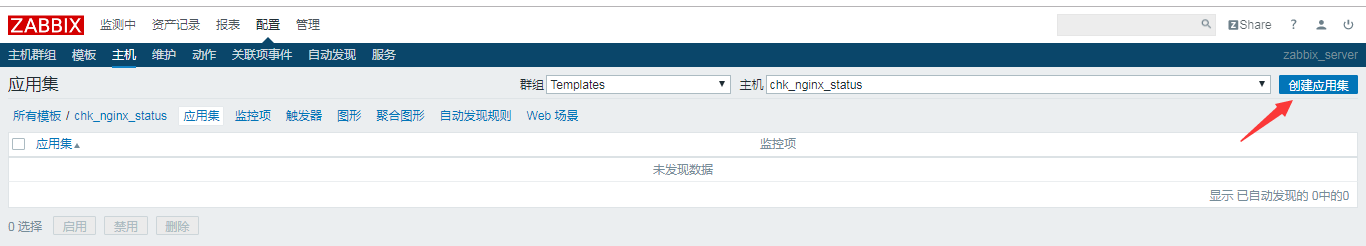
3) 创建应用集
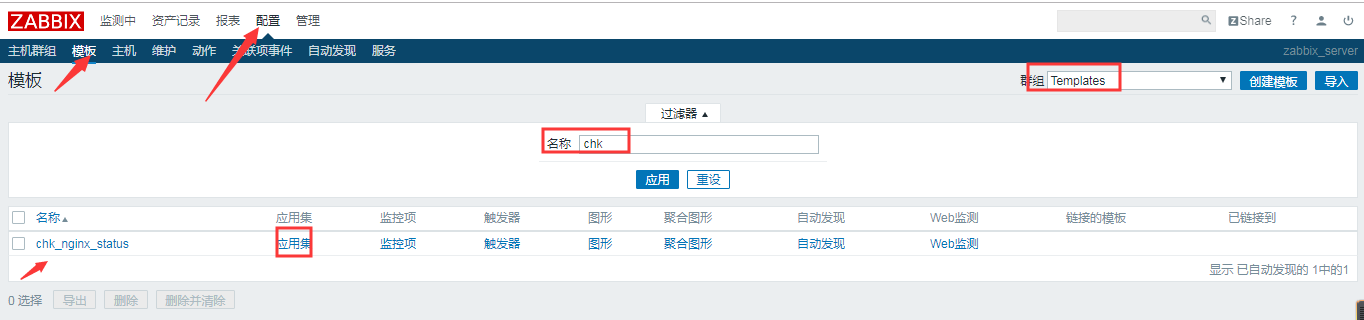
点击应用集==》创建应用集

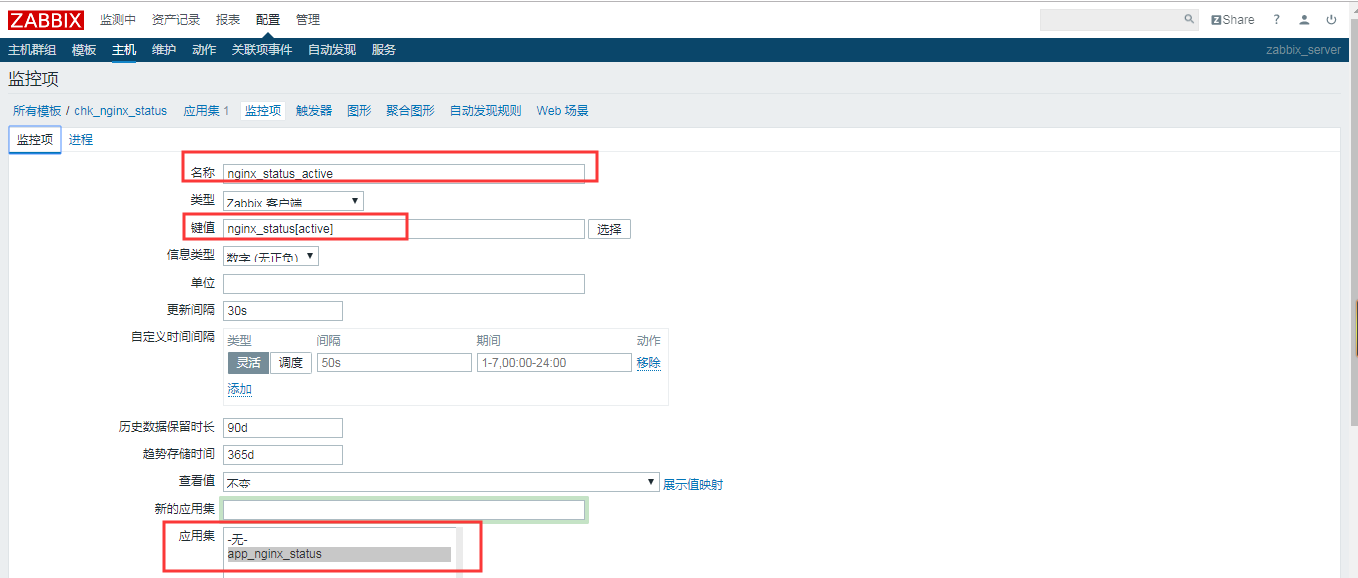
4)创建监控项
点击监控项进入==》创建监控项


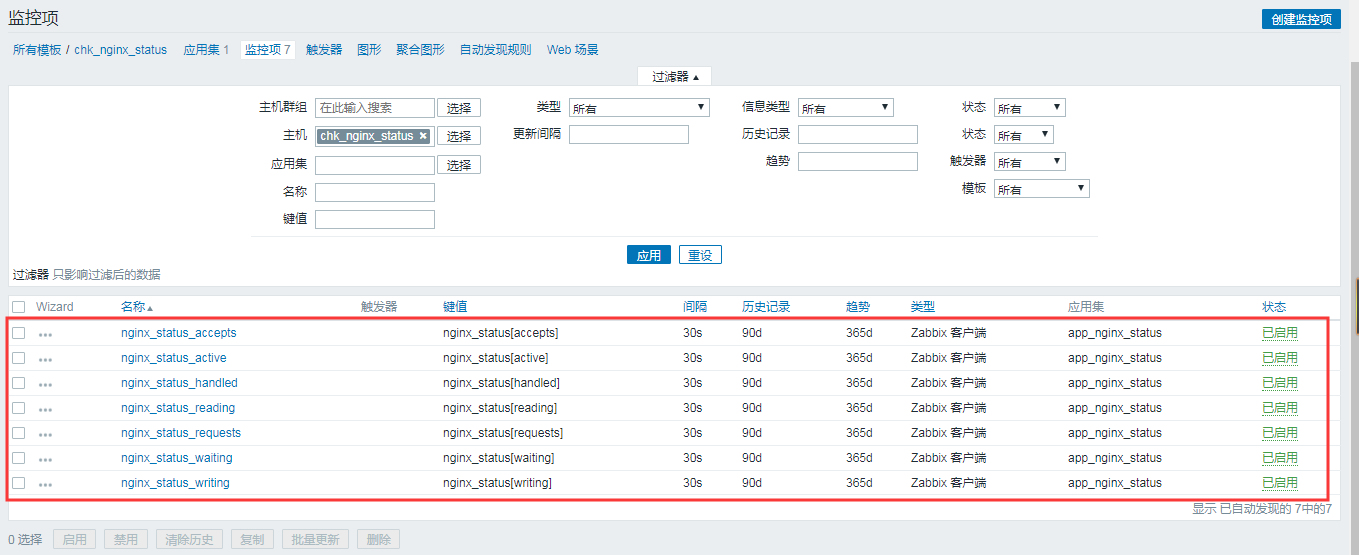
这里以active为例,其余一样创建即可,这里的键值要和我们创建的键值文件名称一致
创建后如下图:
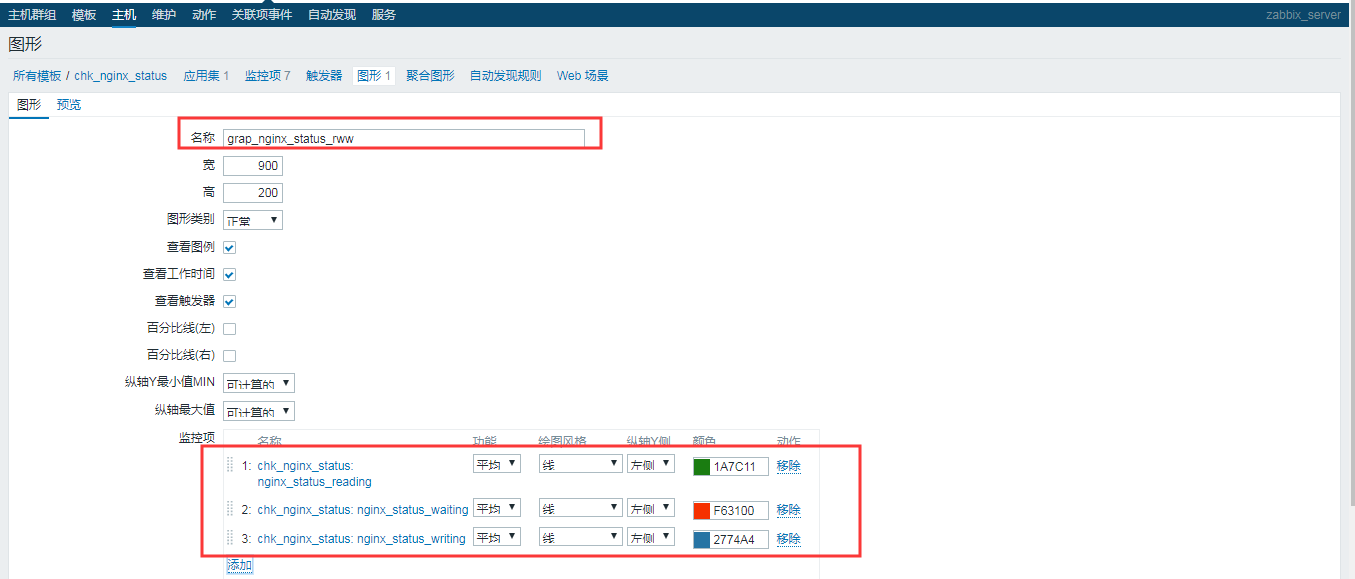
5)创建图形


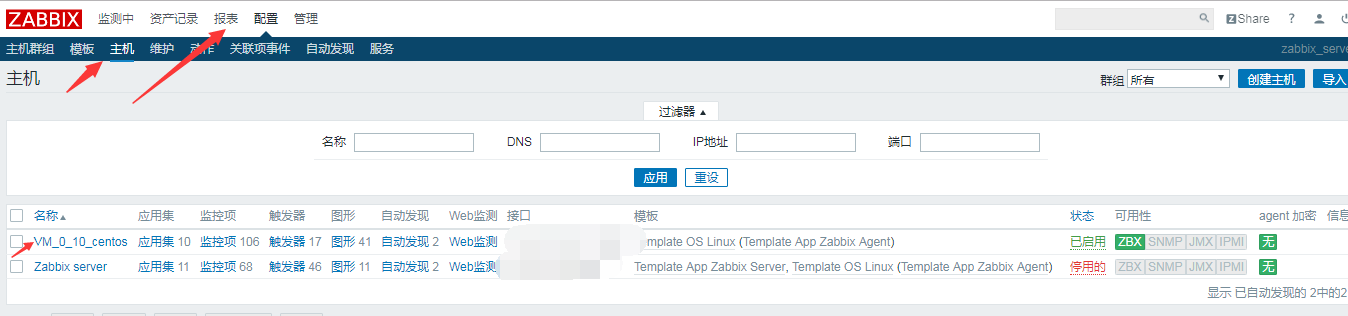
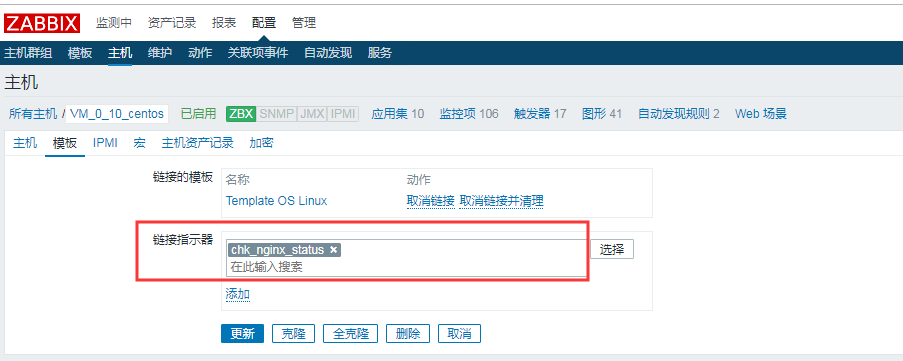
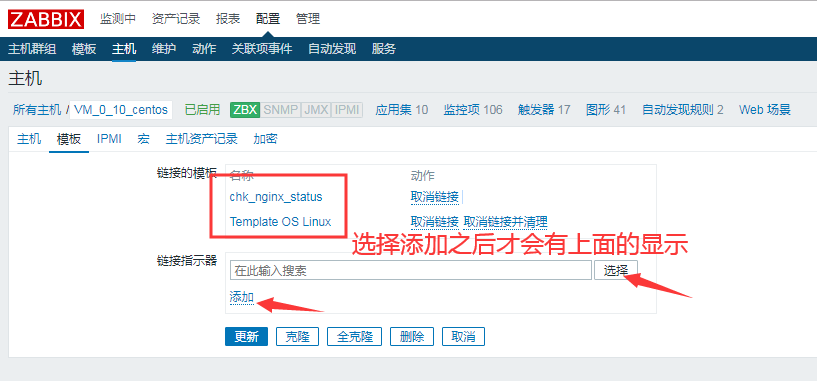
6)将模板链接到被监控主机
7)查看数据


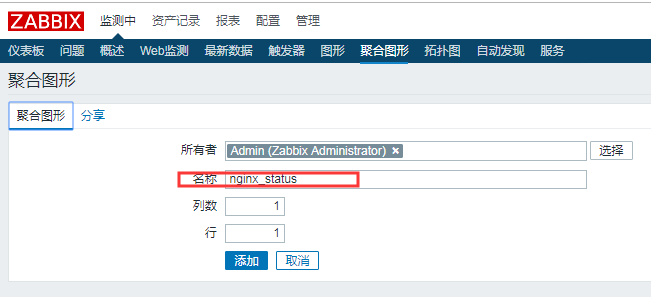
8)创建聚合图形

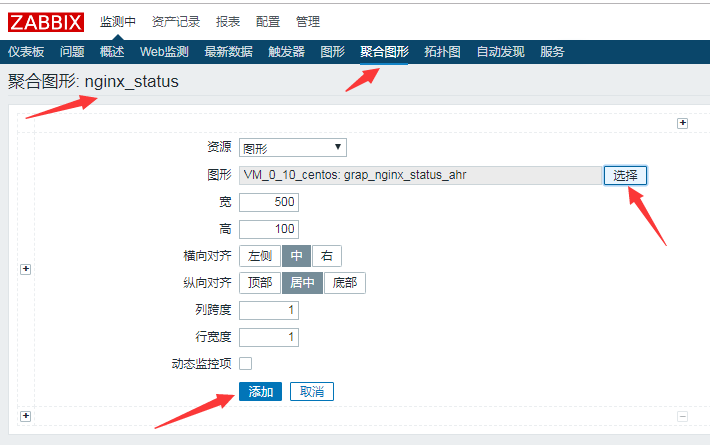
PS:其余的一样添加
最终结果为:

至此,nginx的监控就配置完成了