1,设置Highcharts的动态宽高。
获取Highcharts图表需要的宽高值,给到Highcharts图表的div容器。
如:var hpvCountSendDateHei = $(".hpvCountSendDate_Box").height()+110; //110 矫正值
var hpvCountSendDateWidth = $(".hpvCountSendDate_Box").width();
$(".attrVlaueThree").height(hpvCountSendDateHei-110);
2,宽度为400,Highcharts绘制出来的图为600,溢出div容器外
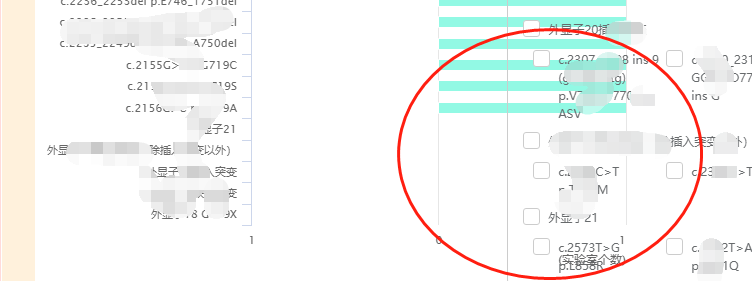
解决方案:给Highcharts一个width值。
var hpvCountSendDateWidthChart = $(".hpvCountSendDate_Box").width();//获取right侧width(和柱图一样的元素width)
$("#"+batchIdS_N).highcharts({
    chart: {
        type: 'bar',
        hpvCountSendDateWidthChart    // 设置Highcharts的width
    },
    title: {
    text: ''
    },
    subtitle: {
    useHTML: true,
    text: ''
    },
    colors:['#B6C6FA','#92F9E4'], // 柱图颜色
    credits: {
          enabled: false //不显示LOGO
     },

    xAxis: [{
    categories: [1,2,3,4,512,43,65,89],
    reversed: false,
    labels: {
        step: 1
    }
    }],
   yAxis: {
    title: {
        text: "(实验室个数)",
        align:"high",
    },
    allowDecimals:false,
    labels: {
        formatter: function () {
            return (Math.abs(this.value) / 1) ;
        }
    },
    min: -100,
    max: 100
    },
    legend: {
    align: 'center',
    verticalAlign: 'top',
    y: 0,
    x:25,
    floating: false,
    borderWidth: 0
    },
    plotOptions: {
    series: {
        stacking: 'normal'
    },
    column:{
        pointWidth:10
    }
    },
    tooltip: {
    formatter: function () {
        return '<b>' + this.series.name + ', 型别名称 ' + this.point.category + '</b><br/>' +
                    '实验室个数: ' + Highcharts.numberFormat(Math.abs(this.point.y), 0);
    }
    },
    series: [{
    name: '阳性',
    data: [90,422,43,45,675,45]
    }, {
    name: '阴性',
    data: [23,434,656,23,648,89]
    }]

})
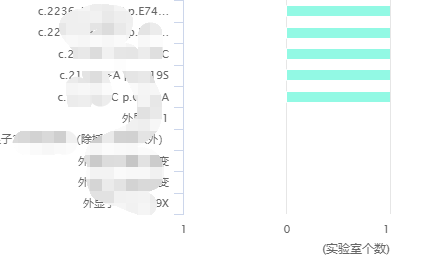
正常了: