如何使用WPFToolKit Chart
private void button1_Click(object sender, EventArgs e)
{
    var s = new Series();
    s.ChartType = SeriesChartType.Line;

    var d = new DateTime(2013, 04, 01);

    s.Points.AddXY(d, 3);
    s.Points.AddXY(d.AddMonths(-1), 2);
    s.Points.AddXY(d.AddMonths(-2), 1);
    s.Points.AddXY(d.AddMonths(-3), 4);

    chart1.Series.Clear();
    chart1.Series.Add(s);


    chart1.Series[0].XValueType = ChartValueType.DateTime;
    chart1.ChartAreas[0].AxisX.LabelStyle.Format = "yyyy-MM-dd";
    chart1.ChartAreas[0].AxisX.Interval = 1;
    chart1.ChartAreas[0].AxisX.IntervalType = DateTimeIntervalType.Months;
    chart1.ChartAreas[0].AxisX.IntervalOffset = 1;

    chart1.Series[0].XValueType = ChartValueType.DateTime;
    DateTime minDate = new DateTime(2013, 01, 01).AddSeconds(-1);
    DateTime maxDate = new DateTime(2013, 05, 01); // or DateTime.Now;
    chart1.ChartAreas[0].AxisX.Minimum = minDate.ToOADate();
    chart1.ChartAreas[0].AxisX.Maximum = maxDate.ToOADate();
}
或者
<charting:Chart x:Name="chtSummary" Width="770" Height="400" Title="My Chart Title">
<charting:Chart.TitleStyle>
 <Style TargetType="datavis:Title">
 <Setter Property="FontSize" Value="28" />
 <Setter Property="FontFamily" Value="Arial" />
 <Setter Property="Margin" Value="5, 10, 5, 15" />
 </Style> </charting:Chart.TitleStyle>
 <charting:Chart.LegendStyle>
 <Style TargetType="datavis:Legend">
 <Setter Property="Width" Value="0" />
 </Style> </charting:Chart.LegendStyle>
 <charting:Chart.Series>
 <charting:BarSeries ItemsSource="{Binding}" DependentValuePath="Value" IndependentValuePath="Key" IsSelectionEnabled="True" >
 <charting:BarSeries.IndependentAxis>
 <charting:CategoryAxis Orientation="Y" AxisLabelStyle="{StaticResource SummaryChartAxisStyle}" />
 </charting:BarSeries.IndependentAxis>
 </charting:BarSeries>
 </charting:Chart.Series>
</charting:Chart>
<!-- See more at: http://mitchelsellers.com/blogs/2011/04/20/wpf-chart-styling-explained.aspx#sthash.EdMcBh2I.dpuf-->
隐藏Legend
隐藏Chart的Legend
<chartingToolkit:Chart.LegendStyle>
    <Style TargetType="Control">
        <Setter Property="Width" Value="0" />
        <Setter Property="Height" Value="0" />
    </Style>
</chartingToolkit:Chart.LegendStyle>
隐藏具体Item的legend
<charting:LineSeries.LegendItemStyle >
  <Style TargetType="{x:Type charting:LegendItem}">
     <Setter Property="Visibility" Value="Collapsed"/>
  </Style>
</charting:LineSeries.LegendItemStyle>
显示定义横纵坐标
<Grid Height="800">
        <chartingToolkit:Chart  Name="lineChart" Title="Pressure over Time"
    VerticalAlignment="Top" Margin="20,50,20,0" Height="500">
            <chartingToolkit:Chart.Axes>
                <chartingToolkit:LinearAxis Title="Pressure" Orientation="Y" Interval="100" />
                <chartingToolkit:LinearAxis Title="Time" Orientation="X" Interval="100" />
            </chartingToolkit:Chart.Axes>
            <chartingToolkit:LineSeries DependentValuePath="Value" IndependentValuePath="Key" ItemsSource="{Binding}"  Name="Test"
                                        IsSelectionEnabled="True" ClipToBounds="False">
            </chartingToolkit:LineSeries>        </chartingToolkit:Chart>
        <Button Width="100" Height="24" Margin="20,556,1058,220" Content="More" Name="Button1" />
    </Grid>
修改横纵坐标
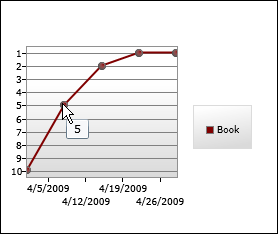
坐标值倒序排列
public class InverterConverter : IValueConverter
{
    public object Convert(object value, Type targetType, object parameter, CultureInfo culture)
    {
        if (value is int)
        {
            return -(int)value;
        }
        throw new NotImplementedException();
    }

    public object ConvertBack(object value, Type targetType, object parameter, CultureInfo culture)
    {
        throw new NotImplementedException();
    }
}
<charting:Chart
    FontSize="9">
    <charting:LineSeries
        ItemsSource="{Binding}"
        DependentValueBinding="{Binding Place, Converter={StaticResource InverterConverter}}"
        IndependentValuePath="Date"
        Title="Book">
        <charting:LineSeries.DataPointStyle>
            <Style TargetType="charting:LineDataPoint">
                <Setter Property="Background" Value="Maroon"/>
                <Setter Property="DependentValueStringFormat" Value="{}{0:0.#;0.#}"/>
            </Style>
        </charting:LineSeries.DataPointStyle>
        <charting:LineSeries.DependentRangeAxis>
            <charting:LinearAxis
                Orientation="Y"
                Minimum="-10.5"
                Maximum="-0.5"
                Interval="1"
                ShowGridLines="True">
                <charting:LinearAxis.AxisLabelStyle>
                    <Style TargetType="charting:AxisLabel">
                        <Setter Property="StringFormat" Value="{}{0:0.#;0.#}"/>
                    </Style>
                </charting:LinearAxis.AxisLabelStyle>
            </charting:LinearAxis>
        </charting:LineSeries.DependentRangeAxis>
    </charting:LineSeries>
</charting:Chart>
参考 http://dlaa.me/blog/post/9607895
修改ToolTips
<ToolTipService.ToolTip>
    <StackPanel>
        <ContentControl
            Content="Custom ToolTip"
            FontWeight="Bold"/>
        <ContentControl
            Content="{TemplateBinding FormattedDependentValue}"/>
    </StackPanel>
</ToolTipService.ToolTip>
http://dlaa.me/blog/post/9631686
参考
My new home page, extended [Updated collection of great Silverlight and WPF Charting resources!]