1.Spring Boot监控管理 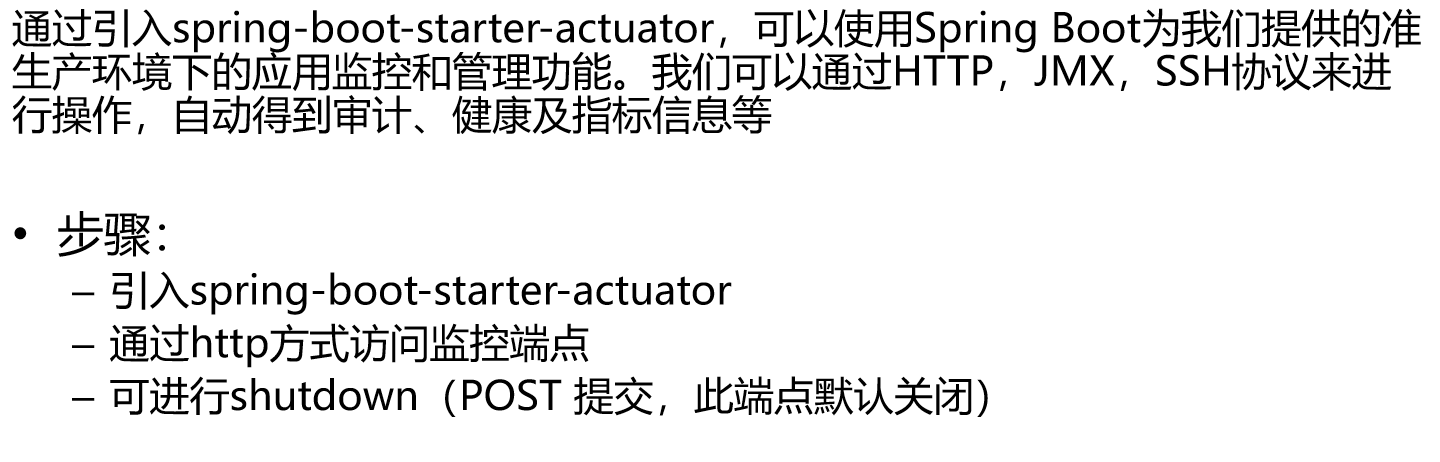
2.Spring Boot监控管理
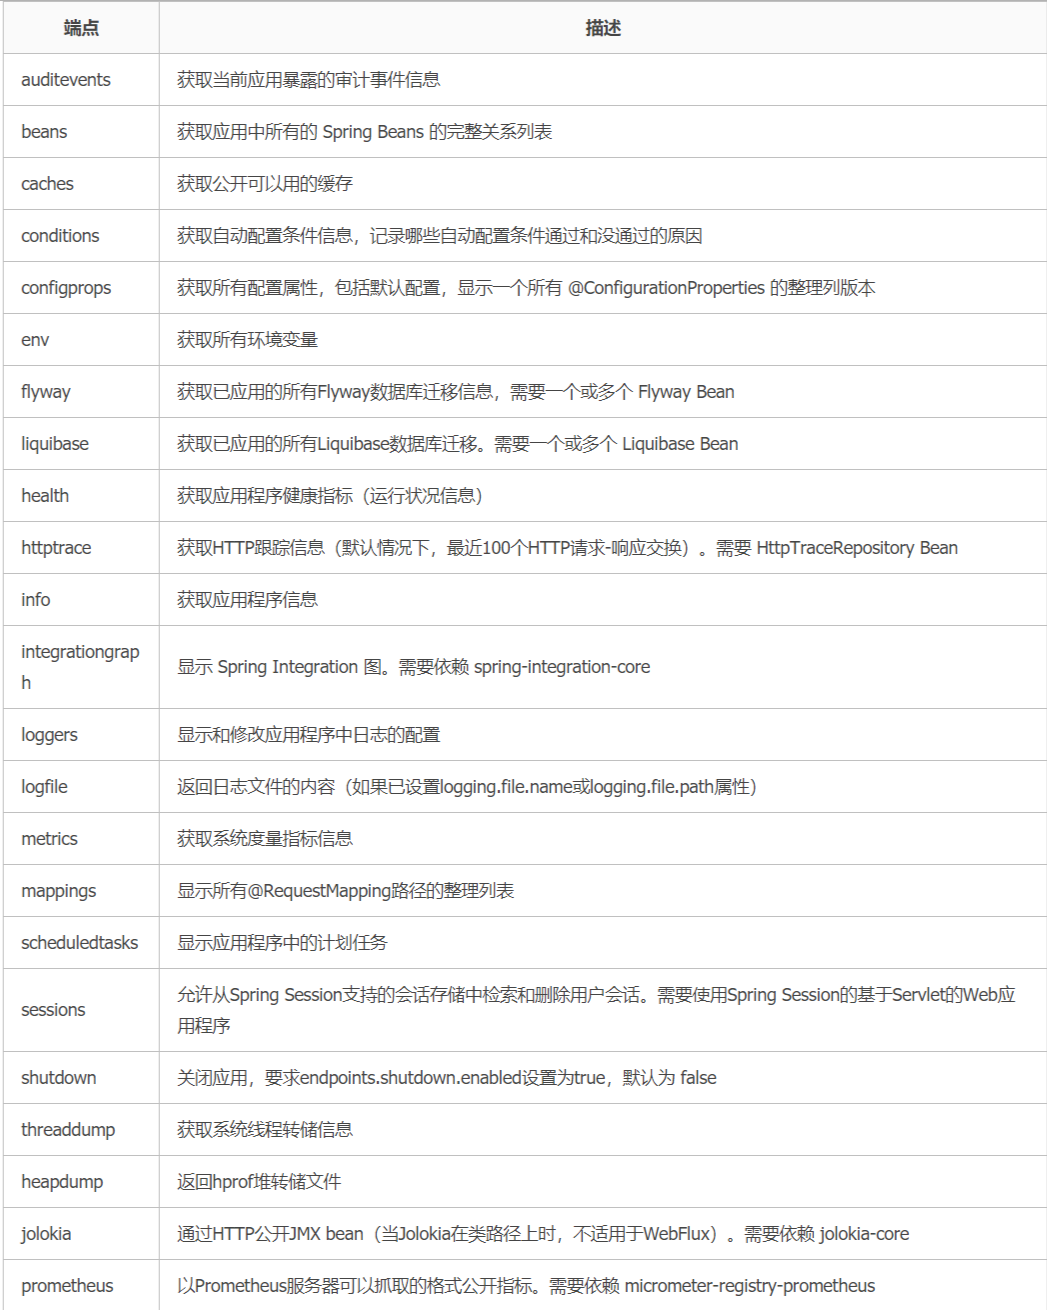
(1).管理端点

(2).创建工程


(3).配置applicaiton.properties
|
server.port=80 management.endpoints.web.exposure.include=* management.endpoint.health.show-details=always
info.app.id=1001 info.app.version=1.0.0
management.endpoint.shutdown.enabled=true |

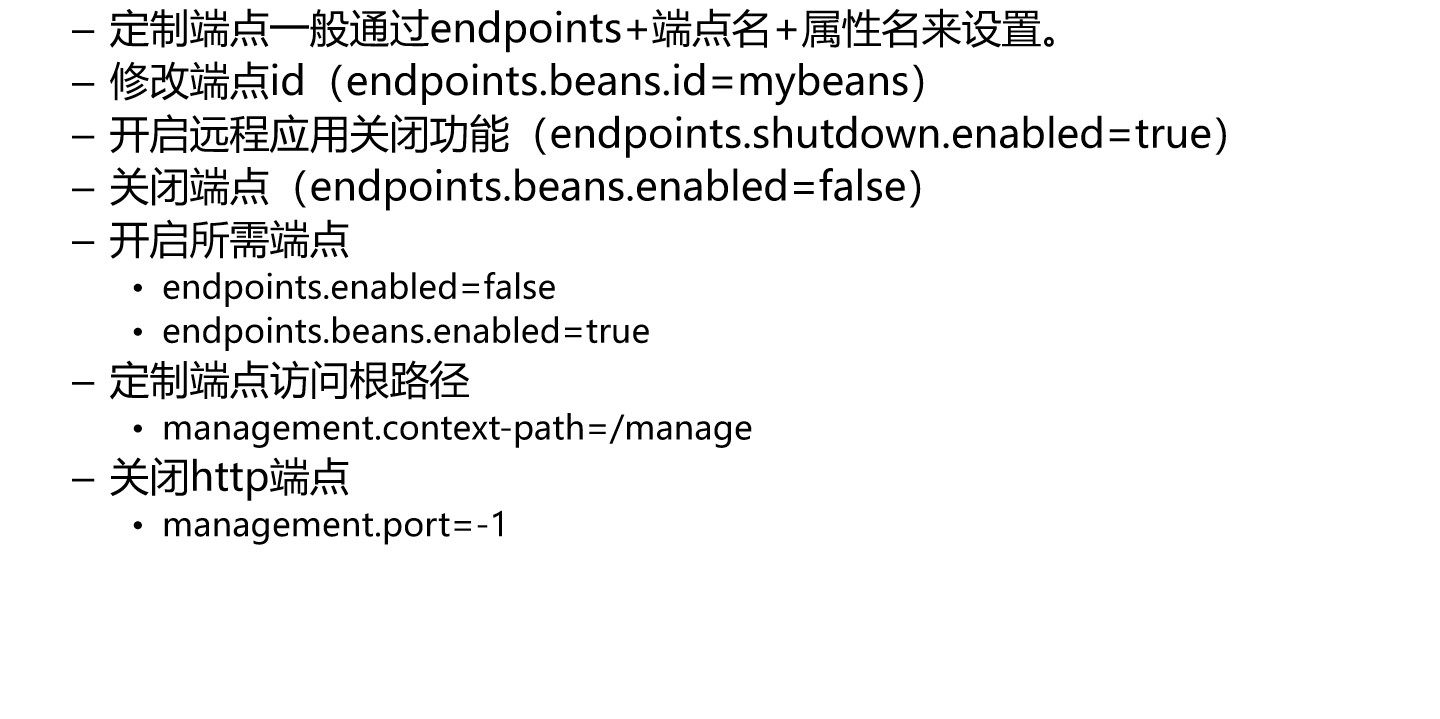
3.Spring Boot端点定制
注:没有management.security.enable的原因
由于spirng boot2(或者叫spring cloud的版本)问题,现在弃用了之前1.5版本的配置写法,下面是新的配置方法。
|
# 设置路由端点,查看json #actuator 启用所有的监控端点 “*”号代表启用所有的监控端点,可以单独启用,例如,health,info,metrics # spring boot 升为 2.0 后,为了安全,默认 Actuator 只暴露了2个端点,heath 和 info management: endpoints: web: exposure: include: "*" endpoint: health: show-details: ALWAYS |
|
访问查看路由映射信息(端口是你项目的端口,启动类注解@SpringBootApplication @EnableZuulProxy不要忘了): http://localhost:8080/actuator/routes http://localhost:8080/actuator/filters |