单因素方程分析
install.packages("multcomp")
library(multcomp)
attach(cholesterol)
table(trt)

aggregate(response, by=list(trt),FUN=mean)

aggregate(response, by=list(trt),FUN=sd)

fit<-aov(response~trt)

summary(fit)


         Df   Sum Sq   Mean Sq   F value   Pr(>F)
trt           4         1351.4           337.8         32.43          9.82e-13 ***
Residuals    45        468.8            10.4
---
Signif. codes: 0 ‘***’ 0.001 ‘**’ 0.01 ‘*’ 0.05 ‘.’ 0.1 ‘ ’ 1
install.packages("gplots")
library(gplots)
plotmeans(response~trt,xlab="Treatment",ylab="Response", main="Mean Plot
with 95% CI")
detach(cholesterol)

#多重比较
TukeyHSD(fit)

par(las=2)
par(mar=c(5,8,4,2))
plot(TukeyHSD(fit))

library(multcomp)
par(mar=c(5,4,6,2))
tuk<-glht(fit,linfct=mcp(trt="Tukey"))
plot(cld(tuk,level=.05),col="lightgrey")

#离群点检测 -
#评估检验的假设条件
library(car)
qqPlot(lm(response~trt,data=cholesterol),simulate=TRUE,main="Q-Q Plot",labels=FALSE)

#Bartlett检验
bartlett.test(response~trt,data=cholesterol)
Bartlett test of homogeneity of variances
data: response by trt
Bartlett's K-squared = 0.57975, df = 4, p-value = 0.9653
outlierTest(fit) #离群点检测

No Studentized residuals with Bonferonni p < 0.05  没发现离群点
Largest |rstudent|:
rstudent unadjusted p-value Bonferonni p
19 2.251149 0.029422 NA
单因素协方差分析
data(litter,package="multcomp")
attach(litter)
table(dose)
weight<-weight[c(1:60)]
gesttime<-gesttime[c(1:60)]
aggregate(weight,by=list(dose),FUN=mean)
fit<-aov(weight~gesttime+dose)
summary(fit)
Df Sum Sq Mean Sq F value Pr(>F)
gesttime 1 107.0 107.04 7.099 0.0101 *
dose 2 45.9 22.97 1.523 0.2269
Residuals 56 844.3 15.08
---
Signif. codes: 0 ‘***’ 0.001 ‘**’ 0.01 ‘*’ 0.05 ‘.’ 0.1 ‘ ’ 1
library(effects)
effect("dose",fit)
dose effect
dose
0.5 1 2
30.44530 31.68956 29.46164
#多重比较
library(multcomp)
contrast<-rbind("no drug vs. drug"=c(3,-1,-1,-1))
summary(glht(fit,linfct=mcp(dose=contrast)))

#评估验证的假设条件
library(multcomp)
fit2<-aov(weight~gesttime*dose,data=litter)
summary(fit2)

#结果可视化
install.packages("HH")
library(HH)
ancova(weight~gesttime+dose,data=litter)

双因素分析
attach(ToothGrowth)
table(supp,dose)

aggregate(len,by=list(supp,dose),FUN=mean)

aggregate(len,by=list(supp,dose),FUN=sd)

dose<-factor(dose)
fit<-aov(len~supp*dose)
summary(fit)
Df Sum Sq Mean Sq F value Pr(>F)
supp 1 205.4 205.4 15.572 0.000231 ***
dose 2 2426.4 1213.2 92.000 < 2e-16 ***
supp:dose 2 108.3 54.2 4.107 0.021860 *
Residuals 54 712.1 13.2
---
Signif. codes: 0 ‘***’ 0.001 ‘**’ 0.01 ‘*’ 0.05 ‘.’ 0.1 ‘ ’ 1
interaction.plot(dose,supp,len,type="b",col=c("red","blue"),pch=c(16,18),main="Interaction between Dose and Supplement Type")
detach(ToothGrowth)

library(gplots)
plotmeans(len~interaction(supp,dose,sep=" "),connect = list(c(1,3,5),c(2,4,6)),col=c("red","darkgreen"),main="Interaction Plot with 95% CIs",xlab="Treatment and Dose Combination")

library(HH)
interaction2wt(len~supp*dose)

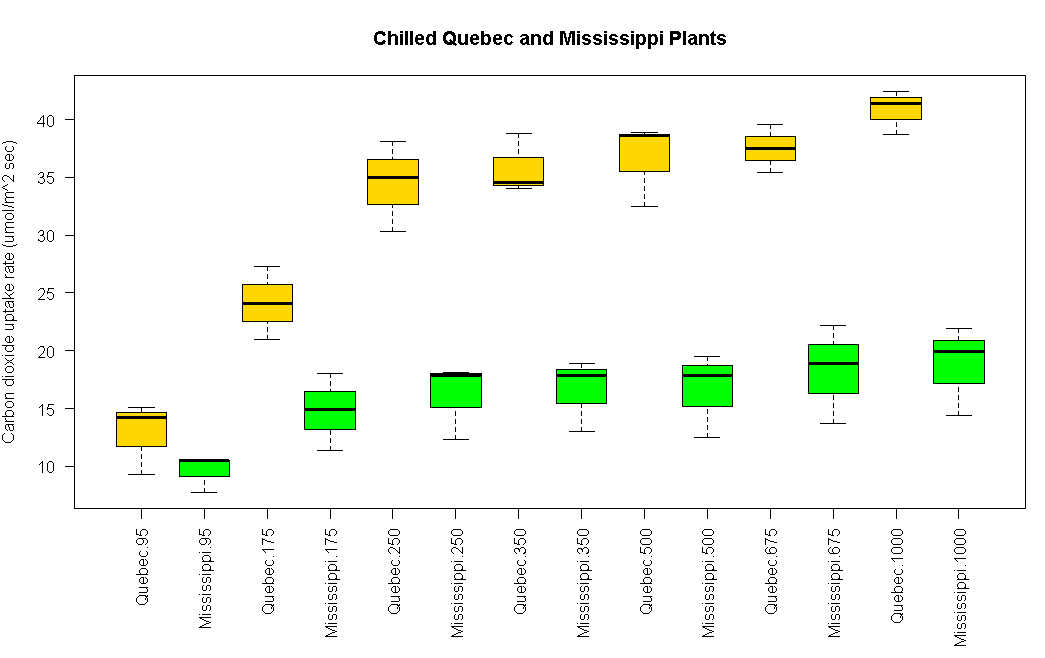
 重复测量方差分析
CO2$conc<-factor(CO2$conc)
w1b1<-subset(CO2,Treatment=='chilled')
fit<-aov(uptake~conc*Type+Error(Plant/(conc)),w1b1)
summary(fit)
Error: Plant
Df Sum Sq Mean Sq F value Pr(>F)
Type 1 2667.2 2667.2 60.41 0.00148 **
Residuals 4 176.6 44.1
---
Signif. codes: 0 ‘***’ 0.001 ‘**’ 0.01 ‘*’ 0.05 ‘.’ 0.1 ‘ ’ 1
Error: Plant:conc
Df Sum Sq Mean Sq F value Pr(>F)
conc 6 1472.4 245.40 52.52 1.26e-12 ***
conc:Type 6 428.8 71.47 15.30 3.75e-07 ***
Residuals 24 112.1 4.67
---
Signif. codes: 0 ‘***’ 0.001 ‘**’ 0.01 ‘*’ 0.05 ‘.’ 0.1 ‘ ’ 1
par(las=2)
par(mar=c(10,4,4,2))
with(w1b1,interaction.plot(conc,Type,uptake,type="b",col=c("red","blue"),pch=c(16,18),main="Interaction Plot for Plant Type and Concentration"))
boxplot(uptake~Type*conc, data=w1b1,col=(c("gold","green")),main="Chilled Quebec and Mississippi Plants",ylab="Carbon dioxide uptake rate (umol/m^2 sec)")
多元方差分析
library(MASS)
attach(UScereal)
shelf<-factor(shelf)
y<-cbind(calories,fat,sugars)
aggregate(y,by=list(shelf),FUN=mean)

cov(y)
calories fat sugars
calories 3895.24210 60.674383 180.380317
fat 60.67438 2.713399 3.995474
sugars 180.38032 3.995474 34.050018
fit<-manova(y~shelf)

summary(fit)
Df Pillai approx F num Df den Df Pr(>F)
shelf 2 0.4021 5.1167 6 122 0.0001015 ***
Residuals 62
---
Signif. codes: 0 ‘***’ 0.001 ‘**’ 0.01 ‘*’ 0.05 ‘.’ 0.1 ‘ ’ 1
summary.aov(fit)
Response calories :
Df Sum Sq Mean Sq F value Pr(>F)
shelf 2 50435 25217.6 7.8623 0.0009054 ***
Residuals 62 198860 3207.4
---
Signif. codes: 0 ‘***’ 0.001 ‘**’ 0.01 ‘*’ 0.05 ‘.’ 0.1 ‘ ’ 1
Response fat :
Df Sum Sq Mean Sq F value Pr(>F)
shelf 2 18.44 9.2199 3.6828 0.03081 *
Residuals 62 155.22 2.5035
---
Signif. codes: 0 ‘***’ 0.001 ‘**’ 0.01 ‘*’ 0.05 ‘.’ 0.1 ‘ ’ 1
Response sugars :
Df Sum Sq Mean Sq F value Pr(>F)
shelf 2 381.33 190.667 6.5752 0.002572 **
Residuals 62 1797.87 28.998
---
Signif. codes: 0 ‘***’ 0.001 ‘**’ 0.01 ‘*’ 0.05 ‘.’ 0.1 ‘ ’ 1
评估假设检验
center<-colMeans(y)
n<-nrow(y)
p<-ncol(y)
cov<-cov(y)
d<-mahalanobis(y,center,cov)
coord<-qqplot(qchisq(ppoints(n),df=p),d,main="Q-Q Plot Assessing Multivariate Normality",ylab="Mahalanobis D2")
abline(a=0,b=1)
identify(coord$x,coord$y,labels=row.names(UScereal))

用回归来做ANOVA

library(multcomp)
levels(cholesterol$trt)
[1] "1time"  "2times" "4times" "drugD"  "drugE"


fit.aov<-aov(response~trt,data=cholesterol)
summary(fit.aov)
Df Sum Sq Mean Sq F value Pr(>F)
trt 4 1351.4 337.8 32.43 9.82e-13 ***
Residuals 45 468.8 10.4
---
Signif. codes: 0 ‘***’ 0.001 ‘**’ 0.01 ‘*’ 0.05 ‘.’ 0.1 ‘ ’ 1
fit.lm<-lm(response~trt,data=cholesterol)
summary(fit.lm)
Call:
lm(formula = response ~ trt, data = cholesterol)
Residuals:
Min 1Q Median 3Q Max
-6.5418 -1.9672 -0.0016 1.8901 6.6008
Coefficients:
Estimate Std. Error t value Pr(>|t|)
(Intercept) 5.782 1.021 5.665 9.78e-07 ***
trt2times 3.443 1.443 2.385 0.0213 *
trt4times 6.593 1.443 4.568 3.82e-05 ***
trtdrugD 9.579 1.443 6.637 3.53e-08 ***
trtdrugE 15.166 1.443 10.507 1.08e-13 ***
---
Signif. codes: 0 ‘***’ 0.001 ‘**’ 0.01 ‘*’ 0.05 ‘.’ 0.1 ‘ ’ 1
Residual standard error: 3.227 on 45 degrees of freedom
Multiple R-squared: 0.7425, Adjusted R-squared: 0.7196
F-statistic: 32.43 on 4 and 45 DF, p-value: 9.819e-13
contrasts(cholesterol$trt)
2times 4times drugD drugE
1time 0 0 0 0
2times 1 0 0 0
4times 0 1 0 0
drugD 0 0 1 0
drugE 0 0 0 1
fit.lm<-lm(response~trt,data=cholesterol,contrasts="contr.helmert")
summary(fit.lm)
Call:
lm(formula = response ~ trt, data = cholesterol, contrasts = "contr.helmert")
Residuals:
Min 1Q Median 3Q Max
-6.5418 -1.9672 -0.0016 1.8901 6.6008
Coefficients:
Estimate Std. Error t value Pr(>|t|)
(Intercept) 5.782 1.021 5.665 9.78e-07 ***
trt2times 3.443 1.443 2.385 0.0213 *
trt4times 6.593 1.443 4.568 3.82e-05 ***
trtdrugD 9.579 1.443 6.637 3.53e-08 ***
trtdrugE 15.166 1.443 10.507 1.08e-13 ***
---
Signif. codes: 0 ‘***’ 0.001 ‘**’ 0.01 ‘*’ 0.05 ‘.’ 0.1 ‘ ’ 1
Residual standard error: 3.227 on 45 degrees of freedom
Multiple R-squared: 0.7425, Adjusted R-squared: 0.7196
F-statistic: 32.43 on 4 and 45 DF, p-value: 9.819e-13