接上文Java各种反射性能对比
BeanUtils.getProperty的原理其实以下方法类似,但稍有不同
-
//代码片段4.1
-
PropertyDescriptor descriptor=null; BeanInfo beanInfo =Introspector.getBeanInfo(SimpleBean.class);PropertyDescriptor[] propertyDescriptors = beanInfo.getPropertyDescriptors();for(PropertyDescriptor propertyDescriptor : propertyDescriptors){if(propertyDescriptor.getName().equals("name")){descriptor=propertyDescriptor;break;}}for(long i =0; i < times; i++){descriptor.getReadMethod().invoke(bean);}
先获取BeanInfo,然后获取所有PropertyDescriptors, 通过与想要获取的属性名对比,比如“name”,来获取对应的propertyDescriptor,最后循环getReadMethod和invoke。
上面的测试消耗了大概2800ms( 因为只缓存了对应的PrepertyDescriptor,而不是对应的method ),BeanUtils.getProperty性能仍只有其1/7。
最开始是怀疑BeanUtils.getProperty没有对获得的PropertyDescriptor进行缓存,每次都重新查找对一个你的PropertyDescriptor,通过阅读源码,发现其通过一个与当前classloader绑定的ContextClassLoaderLocal实例来缓存匹配到的property,属性valueByClassLoader就是用来保存的。
private Map valueByClassLoader = new WeakHashMap();
这样性能应该和上面的一样才对。
通过JProfiler分析调用过程,
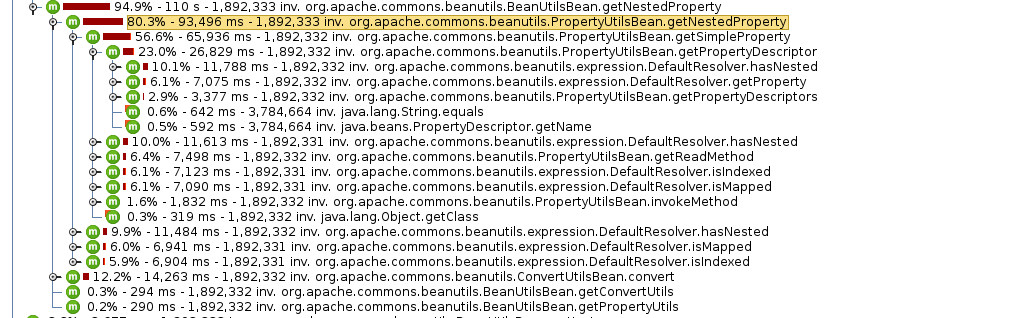
获取PropertyDescriptor[]的调用消耗了2.9%的时间

publicPropertyDescriptor[] getPropertyDescriptors(Object bean){if(bean ==null){thrownewIllegalArgumentException("No bean specified");}return(getPropertyDescriptors(bean.getClass()));}
获取property的readMethod消耗了6.4%的时间

Method getReadMethod(Class clazz,PropertyDescriptor descriptor){return(MethodUtils.getAccessibleMethod(clazz, descriptor.getReadMethod()));}
而真正的method调用只消耗了1.6%的时间

privateObject invokeMethod(Method method,Object bean,Object[] values)throwsIllegalAccessException,InvocationTargetException{if(bean ==null){thrownewIllegalArgumentException("No bean specified "+"- this should have been checked before reaching this method");}try{return method.invoke(bean, values);}catch(NullPointerException cause){....省略}
这些和反射有关的调用其实都没有花太多时间,3000ms×(1.6%+6.4%)=2400ms,和代码片段4.1中的2800ms基本相同.
请看以下的方法调用时间:


这些方法占了整个调用过程的54%的时间,这些是为了使BeanUtils.getProperty不仅仅能够获取bean的一级属性,还能够判断我们所传入的属性是否是嵌套属性,是否是从数组取值或者是map中取值,需要对传入的属性名不断的解析,调用String.length()和String.charAt()两个方法进行循环判断。
感觉大部分情况下,我们都只是解析一级属性,BeanUtils中提供了一个方法,getSimpleProperty,测试的时间并没有比getProperty快多少,1亿次调用时间为15299ms,主要时间和上面一样花在了传入的property name的解析和验证上。