一、定义
- canvas最早是由Apple引入Webkit的,<canvas>元素包含于HTML5中
- HTML5的canvas元素使用JavaScript在网页上绘制图像,画布是一个矩形区域,可以控制其每一像素,拥有多种绘制路径、矩形、圆形、字符以及添加图像的方法
二、基本使用(步骤)
①创建canvas元素,向HTML5页面添加canvas元素(准备画布)
②设置画布宽度和高度(默认是白色的,大小默认300*150)
③通过JavaScript来绘制(在什么地方画)
④准备绘制工具(获取上下文,指一种环境getContext('2d'))
⑤利用工具绘图:移动画笔(moveTo),规定轨迹(lineTo),描边(stroke)或者填充(fill)....
三、体验
①画一条直线
- 关于画布大小的书写位置:设置画布大小在canvas的行内设置,不建议内嵌式或者外链式
- 关于轨迹的理解:轨迹是看不见的,只有通过描边或者填充才能看见形态
- 关于2d的说明:目前只有2d,未来可能出现3d,目前的网页的3d效果通常是使用Web GL制作的
<!DOCTYPE html>
<html lang="en">
<head>
    <meta charset="UTF-8">
    <title>canvas的基本使用</title>
    <style>
        canvas{
            border: 1px solid #ccc;
        }
    </style>
</head>
<body>
    <canvas width="600" height="400"></canvas>
    <script>
        var myCanvas=document.querySelector("canvas");
        var ctx=myCanvas.getContext('2d');
        ctx.moveTo(100,100);
        ctx.lineTo(200,100);
        ctx.stroke();
    </script>
</body>
</html>
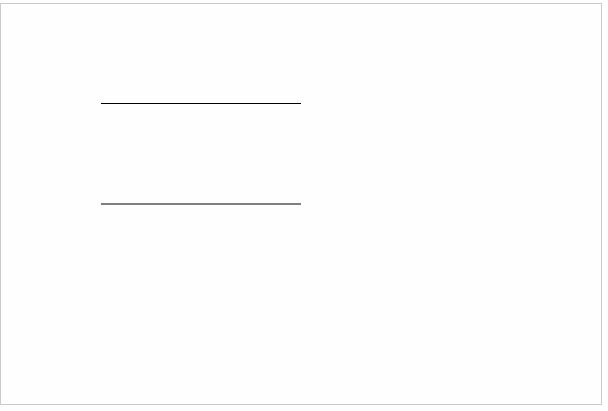
②画两条平行线
- 线条的默认大小和颜色:默认宽度是1px,默认颜色是黑色
- 线条模糊的原因:线条的大小是1像素,是画在画布像素刻度中间的位置,所以会出现不饱和的情况,颜色偏灰,并且因为屏幕的最小单位是1px,所以画布显示的大小会略大
<!DOCTYPE html>
<html lang="en">
<head>
    <meta charset="UTF-8">
    <title>canvas的基本使用</title>
    <style>
        canvas{
            border: 1px solid #ccc;
        }
    </style>
</head>
<body>
    <canvas width="600" height="400"></canvas>
    <script>
        var myCanvas=document.querySelector("canvas");
        var ctx=myCanvas.getContext('2d');
        ctx.moveTo(100,100-0.5);
        ctx.lineTo(300,100-0.5);

        ctx.moveTo(100,200);
        ctx.lineTo(300,200);

        ctx.stroke();
    </script>
</body>
</html>
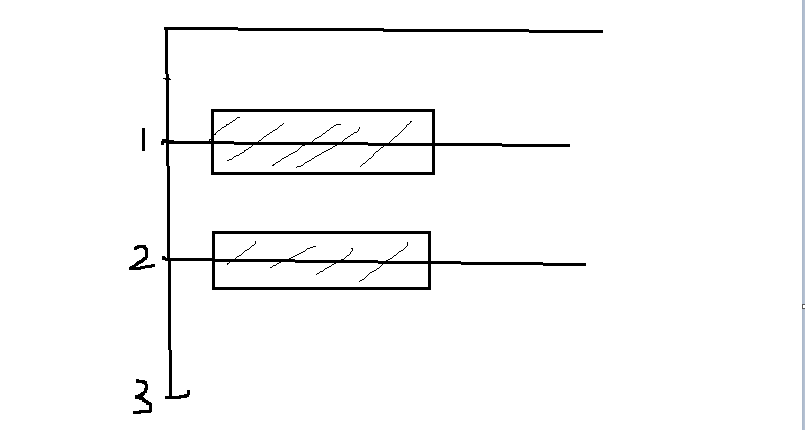
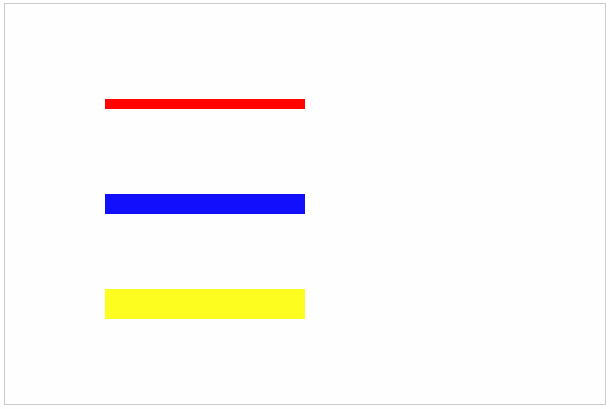
③画三条不同颜色和宽度的平行线
- 颜色:strokeStyle=‘ 颜色’
- 宽度:lineWidth=‘ num ’ (没有单位)
- 解决样式覆盖问题:开启新的路径 beginPath()
<!DOCTYPE html>
<html lang="en">
<head>
    <meta charset="UTF-8">
    <title>canvas的基本使用</title>
    <style>
        canvas{
            border: 1px solid #ccc;
        }
    </style>
</head>
<body>
    <canvas width="600" height="400"></canvas>
    <script>
        var myCanvas=document.querySelector("canvas");
        var ctx=myCanvas.getContext('2d');
        // 红色 10px
        ctx.beginPath();
        ctx.moveTo(100,100);
        ctx.lineTo(300,100);
        ctx.strokeStyle='red';
        ctx.lineWidth='10';
        ctx.stroke();
        // 蓝色 20px
        ctx.beginPath();
        ctx.moveTo(100,200);
        ctx.lineTo(300,200);
        ctx.strokeStyle='blue';
        ctx.lineWidth='20';
        ctx.stroke();
        // 黄色 30px
        ctx.beginPath();
        ctx.moveTo(100,300);
        ctx.lineTo(300,300);
        ctx.strokeStyle='yellow';
        ctx.lineWidth='30';
        ctx.stroke();
    </script>
</body>
</html>
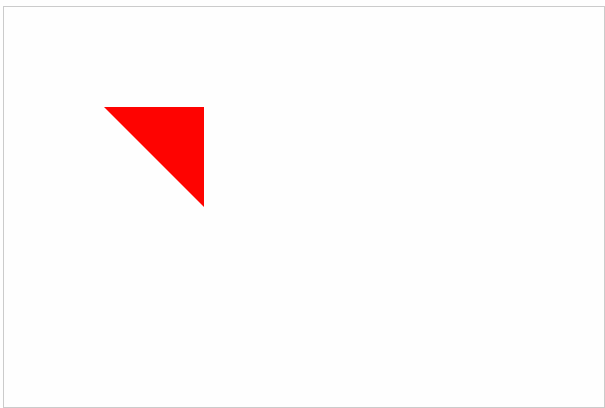
④绘制一个填充颜色的三角形
- 填充 :fill( )
- 填充颜色: fillStyle=‘颜色’
- 描边情况下起始点和lineto的结束点无法完全闭合(缺角)的解决办法:closePath( ) 自动闭合
<!DOCTYPE html>
<html lang="en">
<head>
    <meta charset="UTF-8">
    <title>canvas的基本使用</title>
    <style>
        canvas{
            border: 1px solid #ccc;
        }
    </style>
</head>
<body>
    <canvas width="600" height="400"></canvas>
    <script>
        var myCanvas=document.querySelector("canvas");
        var ctx=myCanvas.getContext('2d');
        ctx.moveTo(100,100);
        ctx.lineTo(200,100);
        ctx.lineTo(200,200);
        //ctx.lineTo(100,100);无法完全闭合
        ctx.closePath();
        //ctx.strokeStyle='red';
        ctx.fillStyle='red';
        //ctx.lineWidth='10';
        //ctx.stroke();
        ctx.fill();
    </script>
</body>
</html>
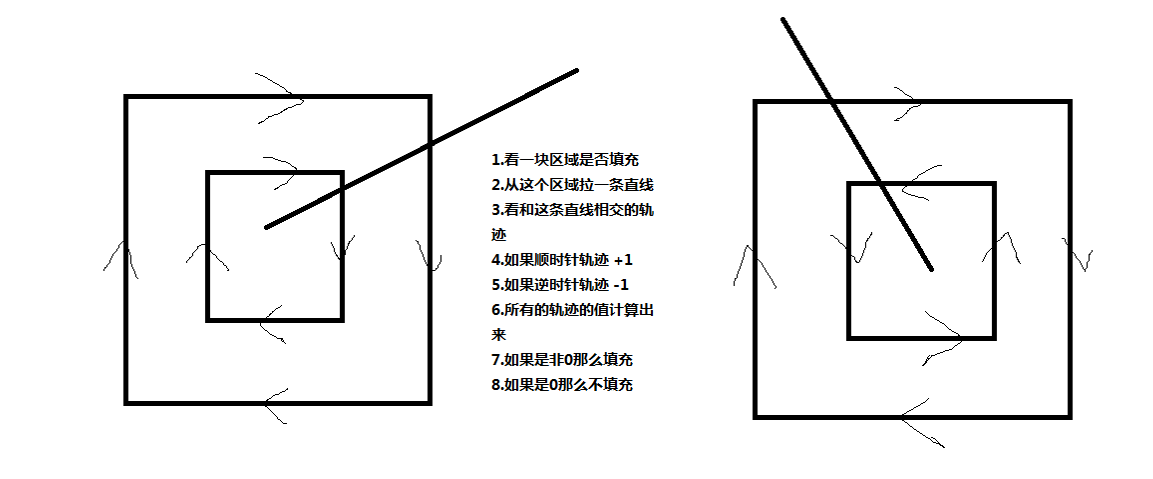
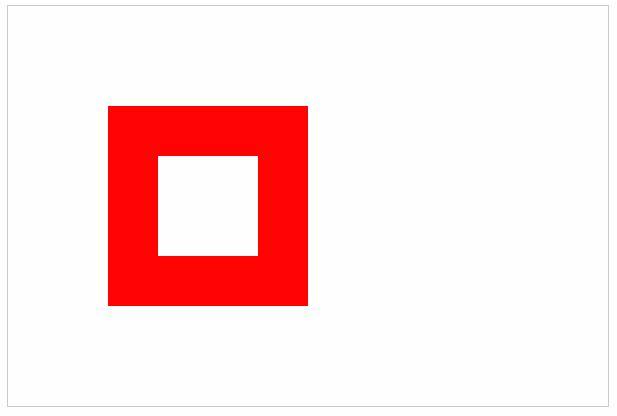
⑤绘制一个镂空的正方形
- 画法:大正方形顺时针,小正方形逆时针
- 原理:非零环绕填充规则
<!DOCTYPE html>
<html lang="en">
<head>
    <meta charset="UTF-8">
    <title>canvas的基本使用</title>
    <style>
        canvas{
            border: 1px solid #ccc;
        }
    </style>
</head>
<body>
    <canvas width="600" height="400"></canvas>
    <script>
        var myCanvas=document.querySelector("canvas");
        var ctx=myCanvas.getContext('2d');
        // 大正方形(顺时针)
        ctx.moveTo(100,100);
        ctx.lineTo(300,100);
        ctx.lineTo(300,300);
        ctx.lineTo(100,300);
        ctx.closePath();
        // 小正方形(逆时针)
        ctx.moveTo(150,150);
        ctx.lineTo(150,250);
        ctx.lineTo(250,250);
        ctx.lineTo(250,150);
        ctx.closePath();
        // 填充
        ctx.fillStyle='red';
        ctx.fill();
    </script>
</body>
</html>
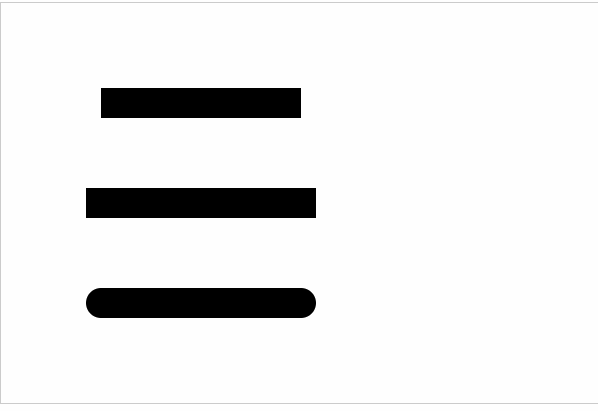
⑥两端样式和拐点样式
- 两端样式:lineCap=“ ” 可以填butt(默认) 、square(方)、round(圆)
<!DOCTYPE html>
<html lang="en">
<head>
    <meta charset="UTF-8">
    <title>canvas的基本使用</title>
    <style>
        canvas{
            border: 1px solid #ccc;
        }
    </style>
</head>
<body>
    <canvas width="600" height="400"></canvas>
    <script>
        var myCanvas=document.querySelector("canvas");
        var ctx=myCanvas.getContext('2d');
        // 两端默认 30px
        ctx.beginPath();
        ctx.moveTo(100,100);
        ctx.lineTo(300,100);
        ctx.lineWidth='30';
        ctx.lineCap='butt';
        ctx.stroke();
        // 两端方形 30px
        ctx.beginPath();
        ctx.moveTo(100,200);
        ctx.lineTo(300,200);
        ctx.lineWidth='30';
        ctx.lineCap='square'
        ctx.stroke();
        // 两端圆形 30px
        ctx.beginPath();
        ctx.moveTo(100,300);
        ctx.lineTo(300,300);
        ctx.lineWidth='30';
        ctx.lineCap='round';
        ctx.stroke();
    </script>
</body>
</html>
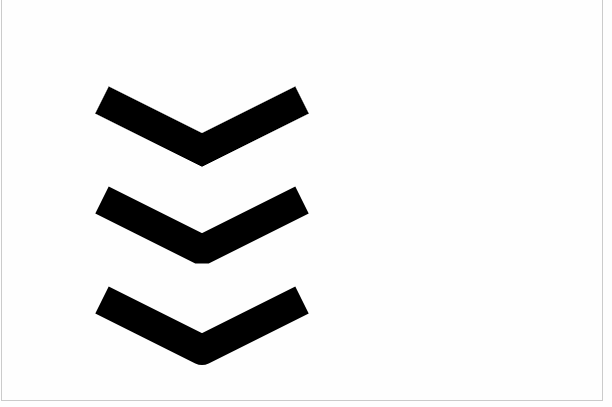
- 拐点样式:lineJoin=‘ ’ 可以填miter(默认)、bevel(方)、round(圆)
<!DOCTYPE html>
<html lang="en">
<head>
    <meta charset="UTF-8">
    <title>canvas的基本使用</title>
    <style>
        canvas{
            border: 1px solid #ccc;
        }
    </style>
</head>
<body>
    <canvas width="600" height="400"></canvas>
    <script>
        var myCanvas=document.querySelector("canvas");
        var ctx=myCanvas.getContext('2d');
        // 拐点默认 30px
        ctx.beginPath();
        ctx.moveTo(100,100);
        ctx.lineTo(200,150);
        ctx.lineTo(300,100);
        ctx.lineWidth='30';
        ctx.lineJoin='miter';
        ctx.stroke();
        // 拐点方形 30px
        ctx.beginPath();
        ctx.moveTo(100,200);
        ctx.lineTo(200,250);
        ctx.lineTo(300,200);
        ctx.lineWidth='30';
        ctx.lineJoin='bevel'
        ctx.stroke();
        // 拐点圆形 30px
        ctx.beginPath();
        ctx.moveTo(100,300);
        ctx.lineTo(200,350);
        ctx.lineTo(300,300);
        ctx.lineWidth='30';
        ctx.lineJoin='round';
        ctx.stroke();
    </script>
</body>
</html>
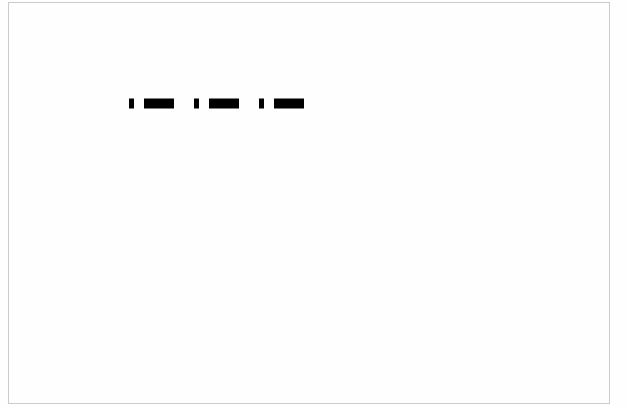
⑦绘制虚线
- 设置虚线的排列方式:setlineDash([ ])数组用来描述排列方式的
- 获取虚线的排列方式:getlineDash()获取的是不重复的那一段排列方式
- 虚线偏移量:lineDashoffset=' num ' 如果是正的,往后偏移;如果是负的往前偏移
<canvas width="600" height="400"></canvas>
    <script>
        var myCanvas=document.querySelector("canvas");
        var ctx=myCanvas.getContext('2d');
        ctx.moveTo(100,100.5);
        ctx.lineTo(300,100.5);
        //虚线是由一段虚线加一段实线组成的,数组描述的就是虚线和实线的大小
        ctx.setLineDash([5,10,30,20]);
        console.log(ctx.getLineDash());//(4) [5, 10, 30, 20]
        ctx.lineDashOffset=-20;
        ctx.lineWidth=10;
        ctx.stroke();
    </script>
</body>
</html>
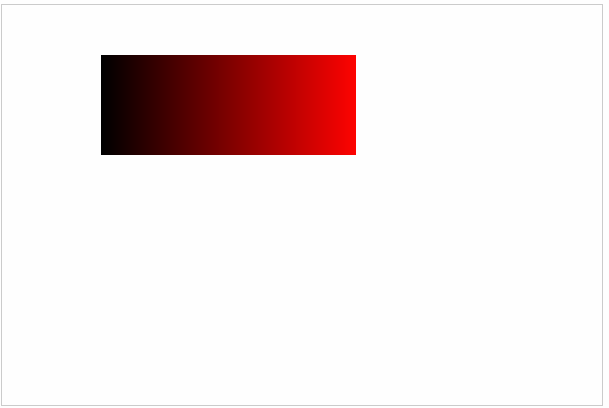
⑧绘制一个颜色渐变的矩形
<!DOCTYPE html>
<html lang="en">
<head>
    <meta charset="UTF-8">
    <title>canvas的基本使用</title>
    <style>
        canvas{
            border: 1px solid #ccc;
        }
    </style>
</head>
<body>
    <canvas width="600" height="400"></canvas>
    <script>
        var myCanvas=document.querySelector("canvas");
        var ctx=myCanvas.getContext('2d');
        ctx.lineWidth=100;
        for(var i=0;i<255;i++){
            ctx.beginPath();
            ctx.moveTo(100+i-1,100);
            ctx.lineTo(100+i,100);
            ctx.strokeStyle='rgba('+i+',0,0)';
            ctx.stroke();
        }
    </script>
</body>
</html>
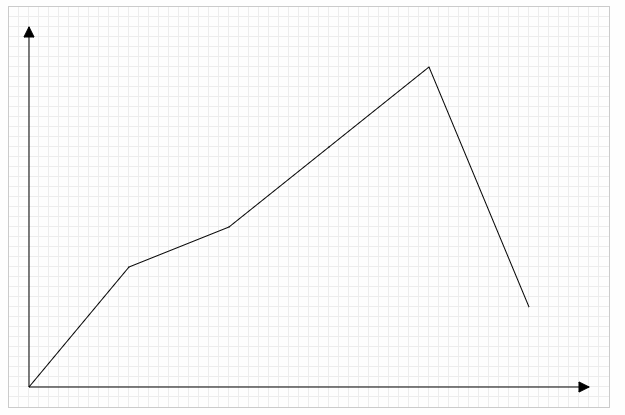
⑨绘制折线图(面向对象)
- 绘制网格
<!DOCTYPE html>
<html lang="en">
<head>
    <meta charset="UTF-8">
    <title>canvas的基本使用</title>
    <style>
        canvas{
            border: 1px solid #ccc;
        }
    </style>
</head>
<body>
    <canvas width="600" height="400"></canvas>
    <script>
        var myCanvas=document.querySelector("canvas");
        var ctx=myCanvas.getContext('2d');
        //网格的大小,画布的宽度和高度
        var gridSize=10;
        var canvasHeight=ctx.canvas.height;
        var canvasWidth=ctx.canvas.width;
        //x轴方向的线
        var xLineTotal=Math.floor(canvasHeight/gridSize);
        for(var i=0;i<xLineTotal;i++){
            ctx.beginPath();
            ctx.moveTo(0,i*gridSize-0.5);
            ctx.lineTo(canvasWidth,i*gridSize-0.5);
            ctx.strokeStyle='#eee';
            ctx.stroke();
        }
        //y轴方向的线
        var yLineTotal=Math.floor(canvasWidth/gridSize);
        for(var i=0;i<yLineTotal;i++){
            ctx.beginPath();
            ctx.moveTo(i*gridSize-0.5,0);
            ctx.lineTo(i*gridSize-0.5,canvasHeight);
            ctx.strokeStyle='#eee';
            ctx.stroke();
        }
    </script>
</body>
</html>
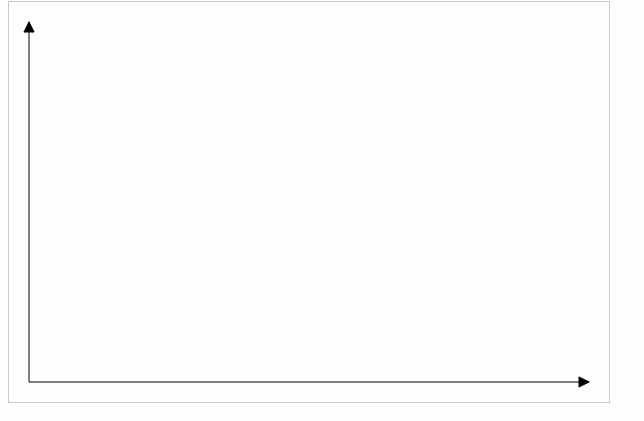
- 绘制坐标系
<!DOCTYPE html>
<html lang="en">
<head>
    <meta charset="UTF-8">
    <title>canvas的基本使用</title>
    <style>
        canvas{
            border: 1px solid #ccc;
        }
    </style>
</head>
<body>
    <canvas width="600" height="400"></canvas>
    <script>
        var myCanvas=document.querySelector("canvas");
        var ctx=myCanvas.getContext('2d');
        // 确定原点的坐标(x0,y0)
        var space=20;
        var canvasWidth=ctx.canvas.width;
        var canvasHeight=ctx.canvas.height;
        var x0=space;
        var y0=canvasHeight-space;
        // 绘制x轴
        ctx.beginPath();
        ctx.moveTo(x0,y0);
        ctx.lineTo(canvasWidth-space,y0);
        // 绘制x轴的箭头
        var arrowSize=10;
        ctx.lineTo(canvasWidth-space-arrowSize,y0+arrowSize/2);
        ctx.lineTo(canvasWidth-space-arrowSize,y0-arrowSize/2);
        ctx.lineTo(canvasWidth-space,y0);
        ctx.fill();
        ctx.stroke();
        // 绘制y轴
        ctx.beginPath();
        ctx.moveTo(x0,y0);
        ctx.lineTo(space,space);
        // 绘制y轴的箭头
        ctx.lineTo(space+arrowSize/2,space+arrowSize);
        ctx.lineTo(space-arrowSize/2,space+arrowSize);
        ctx.lineTo(space,space);
        ctx.fill();
        ctx.stroke();
    </script>
</body>
</html
- 绘制点
<!DOCTYPE html>
<html lang="en">
<head>
    <meta charset="UTF-8">
    <title>canvas的基本使用</title>
    <style>
        canvas{
            border: 1px solid #ccc;
        }
    </style>
</head>
<body>
    <canvas width="600" height="400"></canvas>
    <script>
        var myCanvas=document.querySelector("canvas");
        var ctx=myCanvas.getContext('2d');
        // 点坐标
        var coordinate={
            x:100,
            y:100
        }
        // 点的尺寸大小
        var dottedSize=10;
        // 在画布上绘制点
        ctx.moveTo(coordinate.x-dottedSize/2,coordinate.y-dottedSize/2);
        ctx.lineTo(coordinate.x+dottedSize/2,coordinate.y-dottedSize/2);
        ctx.lineTo(coordinate.x+dottedSize/2,coordinate.y+dottedSize/2);
        ctx.lineTo(coordinate.x-dottedSize/2,coordinate.y+dottedSize/2);
        ctx.closePath();
        ctx.fill();
    </script>
</body>
</html>
- 面向对象的方式绘制折线图
<!DOCTYPE html>
<html lang="en">
<head>
    <meta charset="UTF-8">
    <title>canvas的基本使用</title>
    <style>
        canvas{
            border: 1px solid #ccc;
        }
    </style>
</head>
<body>
    <canvas width="600" height="400"></canvas>
    <script>
        var myCanvas=document.querySelector("canvas");
        var ctx=myCanvas.getContext('2d');
        /*  1.构造折线图的函数 */
        var LineChart=function(ctx){
            // 获取绘图工具
            this.ctx=ctx||document.querySelector('canvas').getContext('2d');
            // 获取画布的大小
            this.canvasWidth=this.ctx.canvas.width;
            this.canvasHeight=this.ctx.canvas.height;
            // 网格的大小
            this.gridSize=10;
            // 坐标系的间距
            this.space=20;
            // 坐标原点
            this.x0=this.space;
            this.y0=this.canvasHeight-this.space;
            // 箭头的大小
            this.arrowSize=10;
            // 绘制点的大小
            this.dottedSize=6;
        }
        /*  2.添加原型方法 */
        // 初始化
        LineChart.prototype.init=function(data){
            this.drawGrid();
            this.drawAxis();
            this.drawDotted(data);
        };
        // 绘制网格
        LineChart.prototype.drawGrid=function(){
            // x轴方向的线
            var xLineTotal=Math.floor(this.canvasHeight/this.gridSize);
            this.ctx.strokeStyle='#eee';
            for(var i=0;i<xLineTotal;i++){
                this.ctx.beginPath();
                this.ctx.moveTo(0,i*this.gridSize-0.5);
                this.ctx.lineTo(this.canvasWidth,i*this.gridSize-0.5);
                this.ctx.stroke();
            }
            // y轴方向的线
            var yLineTotal=Math.floor(this.canvasWidth/this.gridSize);
            for(var i=0;i<yLineTotal;i++){
                this.ctx.beginPath();
                this.ctx.moveTo(i*this.gridSize-0.5,0);
                this.ctx.lineTo(i*this.gridSize-0.5,this.canvasHeight);
                this.ctx.stroke();
            }
        };
        //绘制坐标系
        LineChart.prototype.drawAxis=function(){
            // x轴和x轴的箭头
            this.ctx.beginPath();
            this.ctx.strokeStyle='#000';
            this.ctx.moveTo(this.x0,this.y0);
            this.ctx.lineTo(this.canvasWidth-this.space,this.y0);
            this.ctx.lineTo(this.canvasWidth-this.space-this.arrowSize,this.y0+this.arrowSize/2);
            this.ctx.lineTo(this.canvasWidth-this.space-this.arrowSize,this.y0-this.arrowSize/2);
            this.ctx.lineTo(this.canvasWidth-this.space,this.y0);
            this.ctx.stroke();
            this.ctx.fill();
            // y轴和y轴的箭头
            this.ctx.beginPath();
            this.ctx.strokeStyle='#000';
            this.ctx.moveTo(this.x0,this.y0);
            this.ctx.lineTo(this.space,this.space);
            this.ctx.lineTo(this.space+this.arrowSize/2,this.space+this.arrowSize);
            this.ctx.lineTo(this.space-this.arrowSize/2,this.space+this.arrowSize);
            this.ctx.lineTo(this.space,this.space);
            this.ctx.stroke();
            this.ctx.fill();
        };
        //绘制所有点
        LineChart.prototype.drawDotted=function(data){
            //转化当前对象为that,因为后面循环内的this已经不是当前对象
            var that=this;
            data.forEach(function(item,i){
                // 数据的坐标需要转换为canvas坐标
                var canvasX=that.x0+item.x;//x=原点的x坐标+数据的x坐标
                var canvasY=that.y0-item.y;//y=原点的y坐标+数据的y坐标
                // 进行点的绘制
                that.ctx.beginPath();
                that.ctx.moveTo(canvasX-that.dottedSize/2,canvasY-that.dottedSize/2);
                that.ctx.moveTo(canvasX+that.dottedSize/2,canvasY-that.dottedSize/2);
                that.ctx.moveTo(canvasX+that.dottedSize/2,canvasY+that.dottedSize/2);
                that.ctx.moveTo(canvasX-that.dottedSize/2,canvasY+that.dottedSize/2);
                that.ctx.closePath();
                that.ctx.fill();
                // 连线
                if(i==0){//第一个点,起点是x0,y0
                    that.ctx.beginPath();
                    that.ctx.moveTo(that.x0,that.y0);
                    that.ctx.lineTo(canvasX,canvasY);
                    that.ctx.stroke();
                }else{//后面的点,起点是上一个点
                    that.ctx.beginPath();
                    that.ctx.moveTo(prevCanvasX,prevCanvasY);
                    that.ctx.lineTo(canvasX,canvasY);
                    that.ctx.stroke();
                }
                // 记录当前的坐标,下一次要用
                prevCanvasX=canvasX;
                prevCanvasY=canvasY;
            });
        };
       /* 3.数据和实例化对象 */
       var data=[
           {x:100,y:120},
           {x:200,y:160},
           {x:300,y:240},
           {x:400,y:320},
           {x:500,y:80}
       ]
       var lineChart=new LineChart();
       lineChart.init(data);
    </script>
</body>
</html>