echarts饼图样式

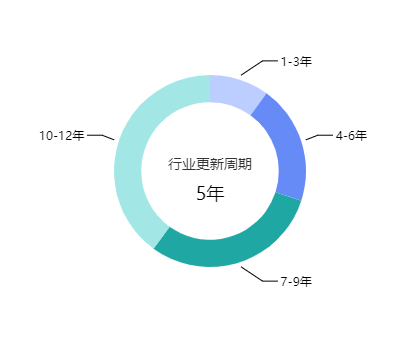
1.中间标题字体大小不一致(可分为一个title一个graphic)

2.labelLine与饼图分离(两个饼图,其中一个显示一个隐藏)

function setmyChartJsgxzq(arr,date) {
    // 基于准备好的dom,初始化echarts实例
    myChartJsgxzq = echarts.init(document.getElementById('jsgxzq'));
    // 指定图表的配置项和数据
    var option = {
        color: moreColor,
        dataset: {
            source: arr
        },
        xAxis: {
            axisLine: {
                show: false
            }
        },
        yAxis: {
            axisLine: {
                show: false
            }
        },
        series: [{
            name : 'show',
            type: 'pie',
            radius: ['43%', '60%'],
            seriesLayoutBy: 'row',
            label: {
                normal: {
                    show: false,
                    color:'#000000'
                },
            }
        },
            {
                name: 'hidden',
                radius: ['60%', '63%'],
                type: 'pie',
                seriesLayoutBy: 'row',
                itemStyle: {
                    opacity: 0,
                },
                label: {
                    normal: {
                        show: true,
                        color:'#000000'
                    },
                },
                labelLine:{
                    normal: {
                        lineStyle: {
                            color: '#000000'
                        },
                        show: true
                    }
                }
            }
        ],
        title: {
            text: '行业更新周期',
            x: 'center',
            y: '44%',
            textStyle: {
                fontWeight: 'normal',
                fontSize: 14
            }
        },
        graphic:{
            type:'text',
            left:'center',
            top:'54%',
            style:{
                text:date,
                textAlign:'center',
                fill:'#000',
                30,
                fontSize:18,
                // height:60
            }
        }
    };
    // 使用刚指定的配置项和数据显示图表。
    myChartJsgxzq.setOption(option);
}

注:arr的数据格式为二维数组

eg:

arr = [
['1-3年','4-6年','7-9年','10-12年'],
[10,20,30,40]
];
date = '5年';
原文地址:https://www.cnblogs.com/DongZixin/p/10869700.html