转自:https://matplotlib.org/api/_as_gen/matplotlib.pyplot.subplot.html
1.有NaN的余弦图subplot
import numpy as np
import matplotlib.pyplot as plt

t = np.arange(0.0, 1.0 + 0.01, 0.01)
s = np.cos(2 * 2*np.pi * t)
t[41:60] = np.nan

plt.subplot(2, 1, 1)#两行一列的子图,目前在第一个位置画。
plt.plot(t, s, '-', lw=2)

plt.xlabel('time (s)')
plt.ylabel('voltage (mV)')
plt.title('A sine wave with a gap of NaNs between 0.4 and 0.6')
plt.grid(True)

plt.subplot(2, 1, 2)#在第二位时
t[0] = np.nan
t[-1] = np.nan#最后一个也是NaN
plt.plot(t, s, '-', lw=2)
plt.title('Also with NaN in first and last point')

plt.xlabel('time (s)')
plt.ylabel('more nans')
plt.grid(True)

#plt.tight_layout()没有这一句的话,第二张图的标题和第一张图的xlabel会重合。
plt.show()

去掉布局的注释:

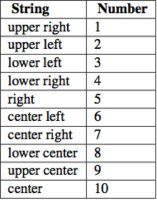
2.图例legend
ax.legend(…., loc=3) 具体对应位置如下图
3.subplots函数返回
  Returns
    -------
    fig : :class:`matplotlib.figure.Figure` object

    ax : Axes object or array of Axes objects.

        ax can be either a single :class:`matplotlib.axes.Axes` object or an
        array of Axes objects if more than one subplot was created.  The
        dimensions of the resulting array can be controlled with the squeeze
        keyword, see above.
4.subplot函数
def subplot(*args, **kwargs):
    """
    Return a subplot axes positioned by the given grid definition.

    Typical call signature::

      subplot(nrows, ncols, plot_number)