转自:https://github.com/huanting74/Coursera-ML-AndrewNg
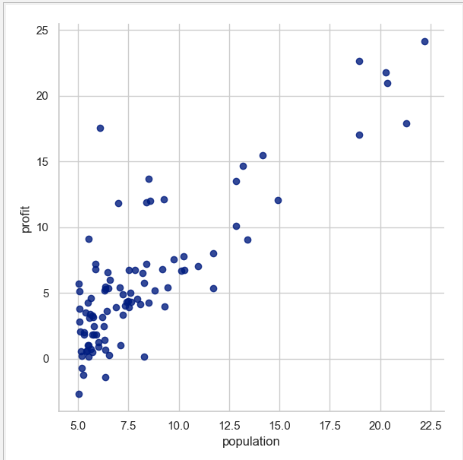
1.可视化数据
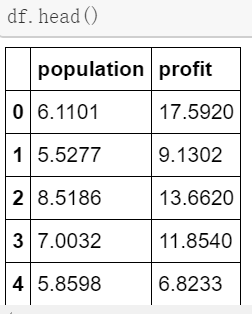
import pandas as pd
import seaborn as sns
import matplotlib.pyplot as plt #需要加载这个包

df = pd.read_csv('data1.txt', names=['population', 'profit'])#直接给两类命名
df.head()
df.info()
sns.set(context="notebook", style="whitegrid", palette="dark")
sns.lmplot('population', 'profit', df, height=6, fit_reg=False)
plt.show()#并且需要show一下才可以显示图像
2.seaborn.lmplot函数
It is intended as a convenient interface to fit regression models across conditional subsets of a dataset.
对数据集的条件子集拟合线性回归模型。

//这里的x和y是data中的列名,不是随便设置的。

//控制每个网格的高度。

//如果是true的话,会拟合出一条直线,那么如下:

根据第三个参数进行画图,使用不同的颜色:
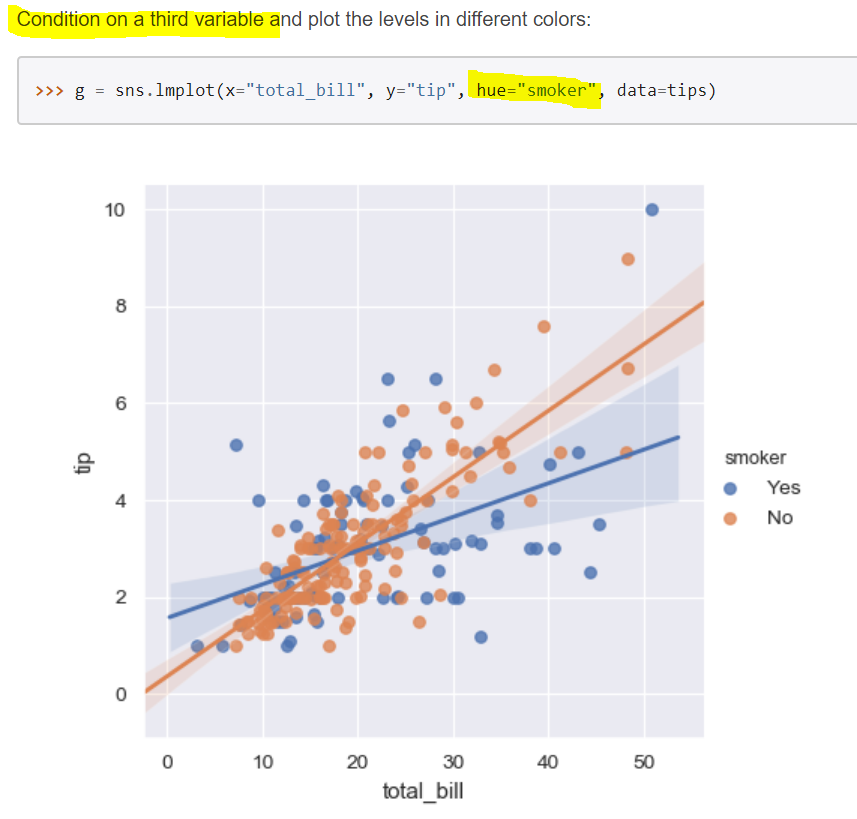
tips:数据格式如下:
 total_bill   tip     sex smoker   day    time  size
0         16.99  1.01  Female     No   Sun  Dinner     2
1         10.34  1.66    Male     No   Sun  Dinner     3
2         21.01  3.50    Male     No   Sun  Dinner     3
3         23.68  3.31    Male     No   Sun  Dinner     2
4         24.59  3.61  Female     No   Sun  Dinner     4
5         25.29  4.71    Male     No   Sun  Dinner     4