1. 生成随机的二维数据:
import numpy as np
x1 = np.array([1, 2, 3, 1, 5, 6, 5, 5, 6, 7, 8, 9, 9])
x2 = np.array([1, 3, 2, 2, 8, 6, 7, 6, 7, 1, 2, 1, 3])
x = np.array(list(zip(x1, x2))).reshape(len(x1), 2) #先将x1和x2用zip组合,然后再转换成list,最后reshape

print (x)
2.生成聚类标签:
from sklearn.cluster import KMeans
kmeans=KMeans(n_clusters=3)   #n_clusters:number of cluster
kmeans.fit(x)
print (kmeans.labels_)
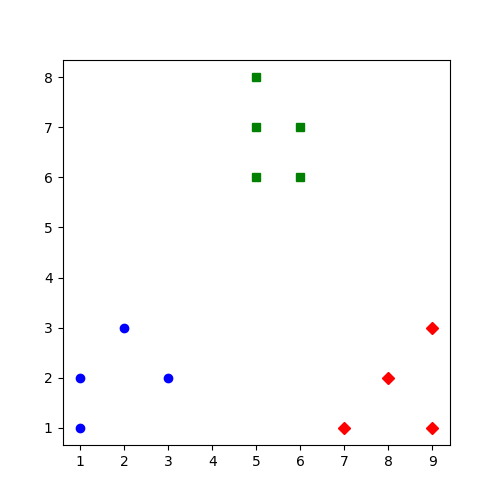
3.显示聚类效果:
import matplotlib.pyplot as plt
plt.figure(figsize=(5,5))
colors = ['b', 'g', 'r']
markers = ['o', 's', 'D']
for i,l in enumerate(kmeans.labels_):
     plt.plot(x1[i],x2[i],color=colors[l],marker=markers[l],ls='None')
plt.show()
参考: https://blog.csdn.net/qq_34264472/article/details/53217748 (此为python2代码)