1. 一个简单的SVM实例:
from sklearn import svm

X = [[2, 0], [1, 1], [2,3]]

y = [0, 0, 1]

clf = svm.SVC(kernel = 'linear')
clf.fit(X, y)

print (clf)

# get support vectors
print (clf.support_vectors_)

# get indices of support vectors
print (clf.support_)

# get number of support vectors for each class
print (clf.n_support_)
2. 稍微复杂一点的线性可分SVM
print(__doc__)

import numpy as np
import pylab as pl
from sklearn import svm

# we create 40 separable points
np.random.seed(0)
X = np.r_[np.random.randn(20, 2) - [2, 2], np.random.randn(20, 2) + [2, 2]]
Y = [0] * 20 + [1] * 20

# fit the model
clf = svm.SVC(kernel='linear')
clf.fit(X, Y)

# get the separating hyperplane
w = clf.coef_[0]
a = -w[0] / w[1]
xx = np.linspace(-5, 5)
yy = a * xx - (clf.intercept_[0]) / w[1]

# plot the parallels to the separating hyperplane that pass through the
# support vectors
b = clf.support_vectors_[0]
yy_down = a * xx + (b[1] - a * b[0])
b = clf.support_vectors_[-1]
yy_up = a * xx + (b[1] - a * b[0])

print ("w: "), (w)
print ("a: "), (a)
# print (" xx: "), (xx)
# print (" yy: "), (yy)
print ("support_vectors_: "), (clf.support_vectors_)
print ("clf.coef_: "), (clf.coef_)

# plot the line, the points, and the nearest vectors to the plane
pl.plot(xx, yy, 'k-')
pl.plot(xx, yy_down, 'k--')
pl.plot(xx, yy_up, 'k--')

pl.scatter(clf.support_vectors_[:, 0], clf.support_vectors_[:, 1],
           s=80, facecolors='none')
pl.scatter(X[:, 0], X[:, 1], c=Y, cmap=pl.cm.Paired)

pl.axis('tight')
pl.show()
结果如下:
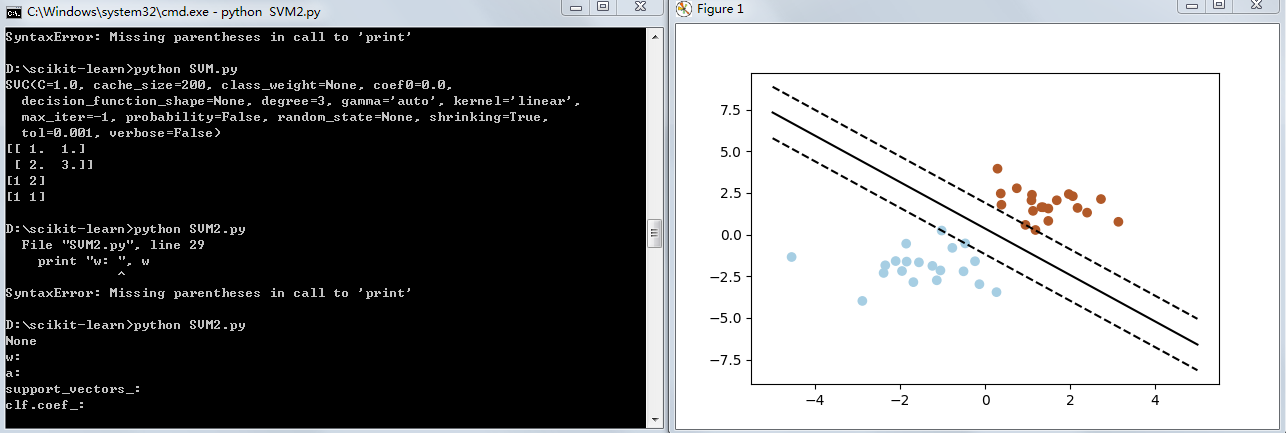
Missing parentheses in call to 'print'——python语法错误
这个消息的意思是你正在试图用python3.x来运行一个只用于python2.x版本的python脚本。
print"Hello world"
上面的语法在python3中是错误的。在python3中,你需要将helloworld加括号,正确的写法如下
print("Hello world")
#所以上面的例子在print时都加了括号