通过查看Nginx的并发连接,我们可以更清除的知道网站的负载情况。Nginx并发查看有两种方法(之所以这么说,是因为笔者只知道两种),一种是通过web界面,一种是通过命令,web查看要比命令查看显示的结果精确一些。下面介绍这两种查看方法;
1.通过浏览器查看
通过web界面查看时Nginx需要开启status模块,也就是安装Nginx时加上 –with-http_stub_status_module 然后配置Nginx.conf,在server点里面加入如下内容。
获取 Nginx 状态( http_stub _status )
[root@localhost nginx]#
[root@localhost nginx]# /usr/local/nginx/sbin/nginx -V
nginx version: nginx/1.8.0
built by gcc 4.4.7 20120313 (Red Hat 4.4.7-17) (GCC)
configure arguments: --prefix=/usr/local/nginx --with-http_stub_status_module
## 查看编译时有没有加入状态监控模块,如果没有需要单独加载
1)编译添加http_stub _status
[root@localhost local]# cd nginx-1.8.0
[root@localhost nginx-1.8.0]# ./configure --prefix=/usr/local/nginx --with-http_stub_status_module
[root@localhost nginx-1.8.0]# make && make install

查看已安装的 Nginx 是否包含 stub_status 模块
[root@localhost nginx-1.8.0]# /usr/local/nginx/sbin/nginx -V
ok,接着配置nginx.conf
[root@localhost local]# vi nginx/conf/nginx.conf

    server {
        listen       80;
        server_name  localhost;

        #charset koi8-r;

        #access_log  logs/host.access.log  main;

        #location / {
           #root   html;
           #index  index.html index.htm;
        #}

       location ~ /nginx_status {
          root   html;
          index  index.html index.htm;
          stub_status on; //#打开目录浏览功能
          access_log off; //#默认为on,显示出文件的确切大小,单位是bytes #显示出文件的大概大小,单位是kB或者MB或者GB
          allow 127.0.0.1; //访问ip
          allow 192.168.0.103; //访问ip
          deny all;
       }
or 通用nginx.conf配置;
user www www;
worker_processes 2;

error_log logs/error.log;
#error_log logs/error.log notice;
#error_log logs/error.log info;

pid logs/nginx.pid;


events {
use epoll;
worker_connections 2048;
}


http {
include mime.types;
default_type application/octet-stream;

#log_format main '$remote_addr - $remote_user [$time_local] "$request" '
# '$status $body_bytes_sent "$http_referer" '
# '"$http_user_agent" "$http_x_forwarded_for"';

#access_log logs/access.log main;

sendfile on;
# tcp_nopush on;

keepalive_timeout 65;

# gzip压缩功能设置
gzip on;
gzip_min_length 1k;
gzip_buffers 4 16k;
gzip_http_version 1.0;
gzip_comp_level 6;
gzip_types text/html text/plain text/css text/javascript application/json
application/javascript application/x-javascript application/xml;
gzip_vary on;

# http_proxy 设置
client_max_body_size 10m;
client_body_buffer_size 128k;
proxy_connect_timeout 75;
proxy_send_timeout 75;
proxy_read_timeout 75;
proxy_buffer_size 4k;
proxy_buffers 4 32k;
proxy_busy_buffers_size 64k;
proxy_temp_file_write_size 64k;
proxy_temp_path /usr/local/nginx/proxy_temp 1 2;

# 设定负载均衡后台服务器列表
upstream backend {
#ip_hash;
server 192.168.10.100:8080 max_fails=2 fail_timeout=30s ;
server 192.168.10.101:8080 max_fails=2 fail_timeout=30s ;
}

# 很重要的虚拟主机配置
server {
listen 80;
server_name itoatest.example.com;
root /apps/oaapp;

charset utf-8;
access_log logs/host.access.log main;

#对 / 所有做负载均衡+反向代理
location / {
root /apps/oaapp;
index index.jsp index.html index.htm;

proxy_pass http://backend;
proxy_redirect off;
# 后端的Web服务器可以通过X-Forwarded-For获取用户真实IP
proxy_set_header Host $host;
proxy_set_header X-Real-IP $remote_addr;
proxy_set_header X-Forwarded-For $proxy_add_x_forwarded_for;
proxy_next_upstream error timeout invalid_header http_500 http_502 http_503 http_504;

}

#静态文件,nginx自己处理,不去backend请求tomcat
location ~* /download/ {
root /apps/oa/fs;

}
location ~ .*.(gif|jpg|jpeg|bmp|png|ico|txt|js|css)$
{
root /apps/oaapp;
expires 7d;
}
location /nginx_status {
stub_status on;
access_log off;
allow 192.168.10.0/24;
deny all;
}

location ~ ^/(WEB-INF)/ {
deny all;
}
#error_page 404 /404.html;

# redirect server error pages to the static page /50x.html
#
error_page 500 502 503 504 /50x.html;
location = /50x.html {
root html;
}
}

## 其它虚拟主机,server 指令开始
}
## 在虚拟主机 server {} 中加入上面配置,也可以单独定义一个专门用于监控的虚拟主机。
## deny all , 拒绝除 allow 中的主机之外所有主机访问此 URL ,实现过程中如果遇到 403 ,有可能是你把自己测试的机器拒绝了!
此处默认只有本地访问,如果远程可以查看需要加相关的IP或者干脆去掉Deny all即可。加密文件可以使用#htpasswd -c /usr/nginx/conf hxb 命令来创建。配置完成后需要重启Nginx服务。
Nginx 监控项解释:
[root@localhost local]# curl http://127.0.0.1/nginx_status
Active connections: 1
server accepts handled requests
 22 22 72
Reading: 0 Writing: 1 Waiting: 0
浏览器访问:
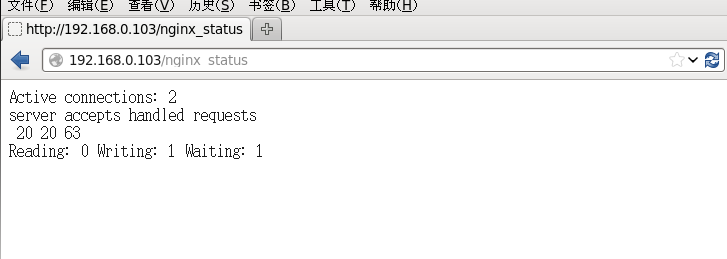
输出含义:
Active connections //当前 Nginx 正处理的活动连接数。
server accepts handledrequests //总共处理了20个连接 , 成功创建 20 次握手,总共处理了63个请求。
Reading //nginx 读取到客户端的 Header 信息数。
Writing //nginx 返回给客户端的 Header 信息数。
Waiting //开启 keep-alive 的情况下,这个值等于 active – (reading + writing),意思就是 Nginx 已经处理完正在等候下一次请求指令的驻留连接
2.通过命令查看:
#netstat -n | awk ‘/^tcp/ {++S[$NF]} END {for(a in S) print a, S[a]}’

TIME_WAIT 17
ESTABLISHED 3254
LAST_ACK 236
FIN_WAIT_1 648
FIN_WAIT_2 581
CLOSING 7
CLOSE_WAIT 4916
补充:
查看Nginx并发进程数:ps -ef | grep nginx | wc -l
查看Web服务器TCP连接状态:netstat -n | awk '/^tcp/ {++S[$NF]} END {for(a in S) print a, S[a]}'