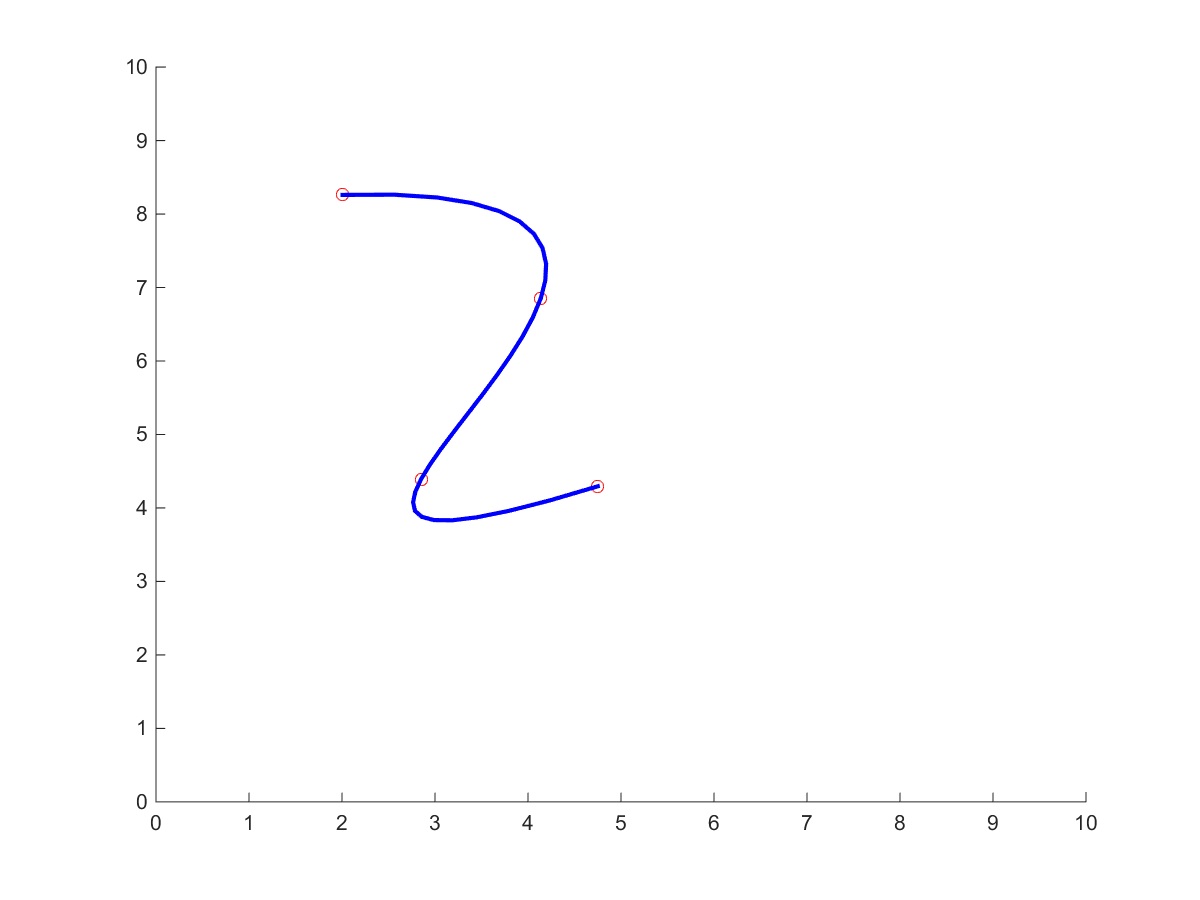
axis([0 10 0 10]);
hold on
xy=[];
n=0;
disp('Left mouse button picks points')
disp('Right mouse button picks last point')
but=1;
while but==1
    [xi,yi,but]=ginput(1);
    plot(xi,yi,'ro')
    n=n+1;
    xy(:,n)=[xi,yi];
end
t=1:n;
ts=1:0.1:n;
xys=spline(t,xy,ts);  % 三次方样条数据插值函数 根据xy的值,每两个xy值之间插入(1/0.01)-1个数,t是xy中个数向量...
%[1 2 3  4...n],xys是最后的值
plot(xys(1,:),xys(2,:),'b-','linewidth',2)
hold off