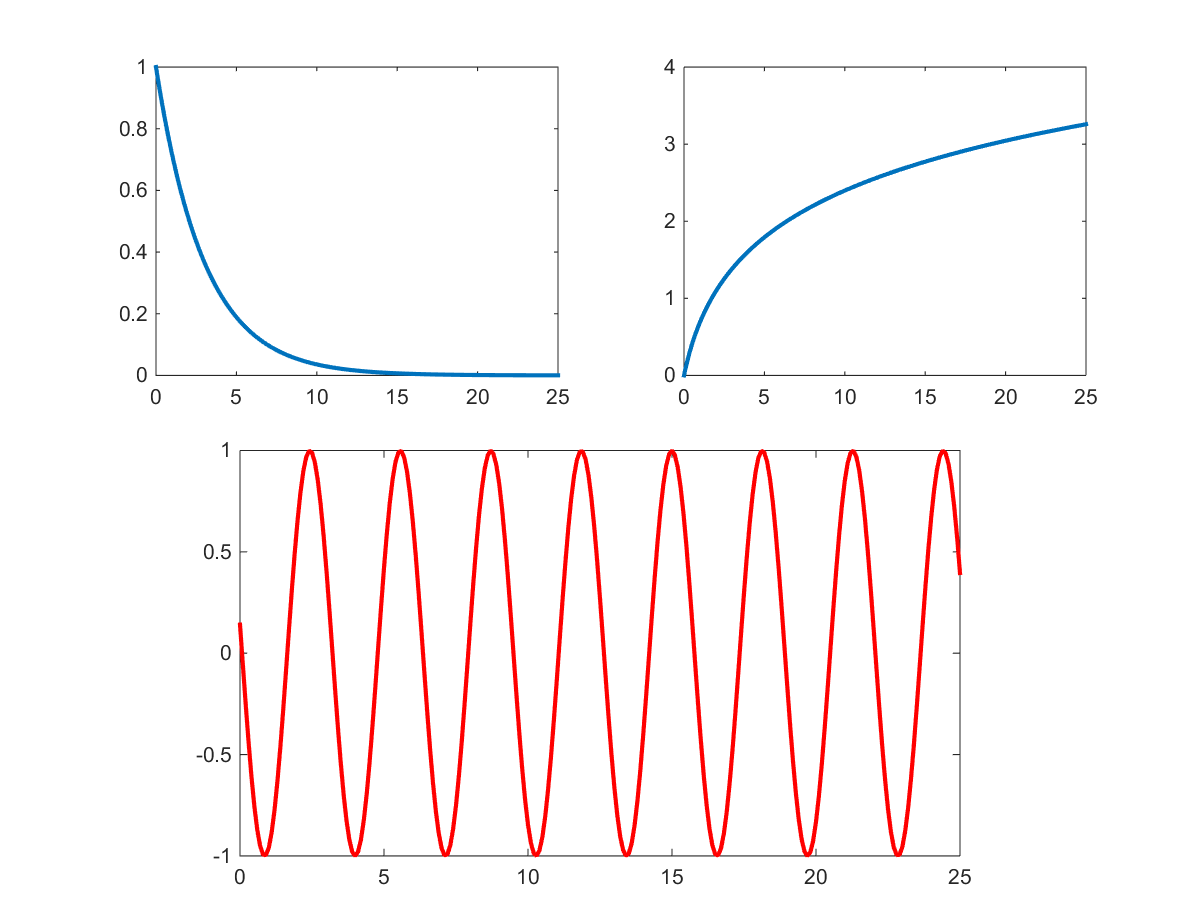
t=[0:0.1:25];
y1=exp(-t/3);
y3=sin(2*t+3);
y2=log(t+1);
subplot(2,2,1)
plot(t,y1,'linewidth',2)
subplot(2,2,2)
plot(t,y2,'linewidth',2)
% subplot(2,2,[3,4])   % 可以这样设置  一张图占多张图的位置
subplot('position',[0.2 0.05 0.6 0.45])
plot(t,y3,'r','linewidth',2)
t=[0:0.1:25];
y1=exp(-t/3);
y3=sin(2*t+3);
y2=log(t+1);
subplot(2,2,1)
plot(t,y1,'linewidth',2)
subplot(2,2,2)
plot(t,y2,'linewidth',2)
% subplot(2,2,[3,4]) % 可以这样设置 一张图占多张图的位置
subplot('position',[0.2 0.05 0.6 0.45])
plot(t,y3,'r','linewidth',2)