Filebeat是本地文件的日志数据采集器,可监控日志目录或特定日志文件(tail file),并将它们转发给Elasticsearch或Logstatsh进行索引、kafka等。带有内部模块(auditd,Apache,Nginx,System和MySQL),可通过一个指定命令来简化通用日志格式的收集,解析和可视化。
组成:
1.Prospectors:一个Filebeat可以有不止一个Prospectors,,对日志文件变化的观察
2.Harvester:如果Prospectors有变化就去收集新的日志信息,一个Harvester处理一个日志文件
处理流程:
1.输入Input
2.处理Filter
3.输出Output
Filebeat并不依赖于ElasticSearch,可以单独存在。我们可以单独使用Filebeat进行日志的上报和搜集。filebeat内置了常用的Output组件, 例如kafka、ElasticSearch、redis等,出于调试考虑,也可以输出到console和file。我们可以利用现有的Output组件,将日志进行上报
搭建环境:
cat /etc/redhat-release
CentOS Linux release 7.7.1908 (Core)
下载filebeat tar包 https://www.elastic.co/cn/downloads/beats/filebeat,,解压,
运行时需要指定配置文件,,yml语法,,以nginx日志收集为例,:
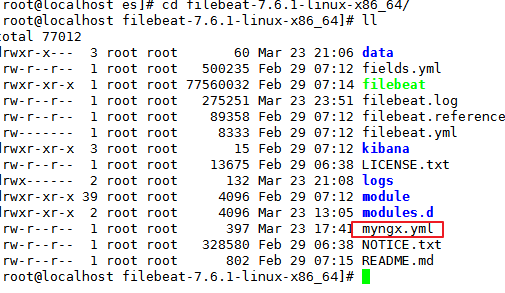
创建配置文件myngx.yml
filebeat.inputs:
- type: log     #指定类型log
  enabled: true
  tags: ["nginx"]
  paths:     #指定日志路径
    - /usr/local/nginx/logs/access.log
setup.template.settings:
  index.number_of_shards: 3
# output.console:
# # pretty: true
# # enable: true
output.elasticsearch:     #指定Elasticsearch服务器
  hosts: ["192.168.28.30"]
FIlebeatOutput支持的输出的常见对象:
1.Console
2.Elasticsearch
3.Logstash
4.Kafaka
5.Redis
6.File
启动filebeat并指定上面的配置文件,将nginx的日志输出传到elasticsearch,可在elassearch-head查看
./filebeat -e -c myngx.yml
刷新,在elasticsearch-head查看数据,,,

可点击查看内容
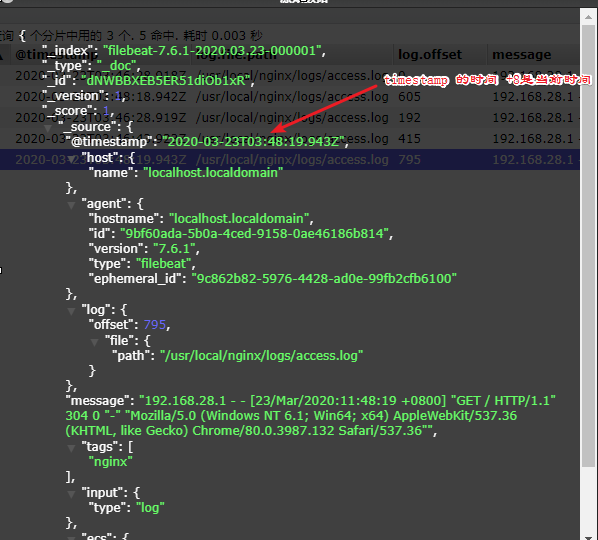
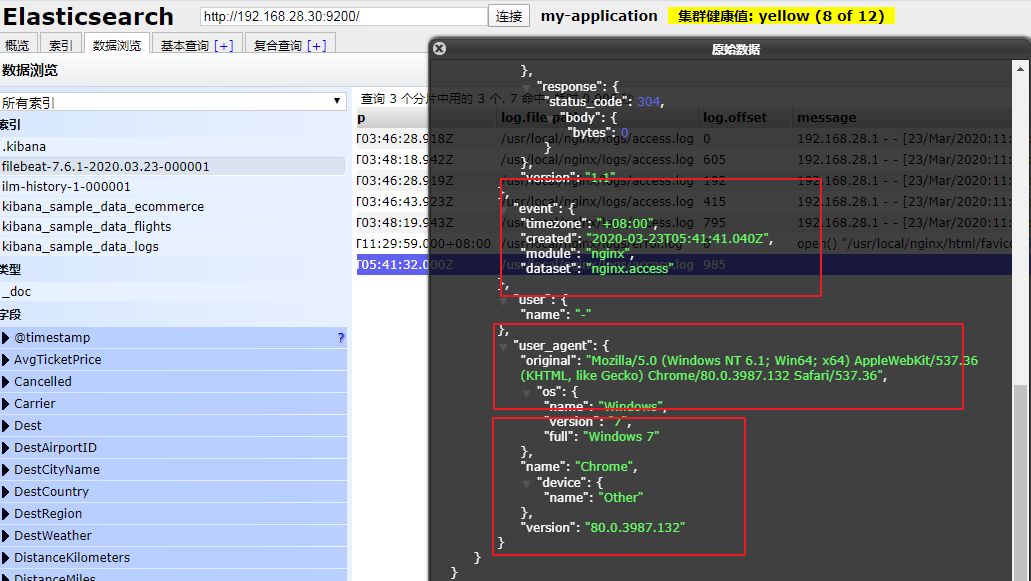
在messaige中看见已经获取到nginx的access日志,但没有经过处理,只读到原始数据,,,,可使用filebeat根目录Modules.d/下面的yml文件来配合使用,,
=================================================================================================================================
Module
在Filebeat中有大量的Module,可以简化日志的配置

在filebeat根目录下执行下面命令可以查看已启用的配置,,
./filebeat modules list
Enabled:

Disabled:
activemq
apache
auditd
aws
azure
cef
cisco
coredns
elasticsearch
envoyproxy
googlecloud
haproxy
ibmmq
icinga
iis
iptables
kafka
kibana
logstash
misp
mongodb
mssql
mysql
nats
netflow
nginx
osquery
panw
postgresql
rabbitmq
redis
santa
suricata
system
traefik
zeek
可见全是disabled,,现以Nginx为例,可以启用nginx
./filebeat modules enable nginx
Enabled nginx
配置nginx的module,,在filebeat的根目录的modules.d中可以查看到nginx.yml文件,,
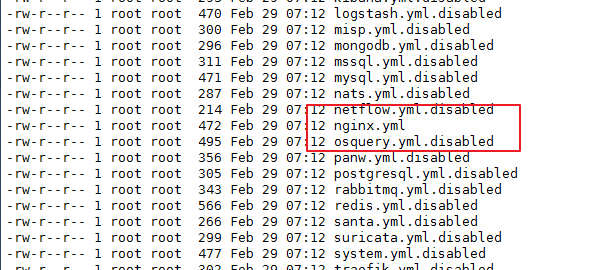
因为启用了上面命令,所以后面没有disabled,,配置一下
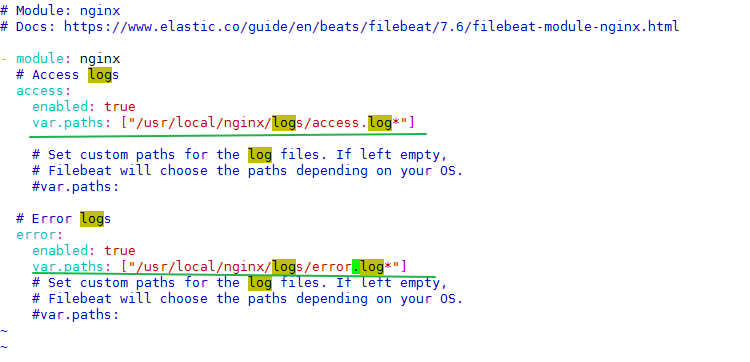
添加nginx日志文件的路径,,就是线上的,,再看下启动时需要指定的配置文件:
cat myngx.yml
filebeat.inputs:
#- type: log
#  enabled: true
#  tags: ["nginx"]
#  paths:
#    - /usr/local/nginx/logs/access.log
setup.template.settings:
  index.number_of_shards: 3
# output.console:
# # pretty: true
# # enable: true
output.elasticsearch:
  hosts: ["192.168.28.30"]
filebeat.config.modules:
  path: ${path.config}/modules.d/*.yml     #指定yml文件路径
  reload.enabled: false
为什么要填星“*”???
启动filebeat,,
nohup ./filebeat -e -c myngx.yml>logs/filebeat.log & #后台启动,并将日志输出到logs/filebeat,log
成功启动再次查看elasticsearch-head,,
发现现实的信息已经变了,,filebeat测试,成功,,
之后还可以将filebeat日志输出到可视化界面Kibana。