【摘要】 介绍Ubuntu 18.04环境下Python3常用科学计算和数据分析包(numpy, scipy, matplotlib, sklearn, pandas)的安装,以及Jupyter Notebook的安装和使用
1. 基础环境
-
2vCPUs | 4GB | kc1.large.2
-
Ubuntu 18.04 64bit with ARM
-
确保已经安装了gcc, cmake
2. Python 3.x验证
Ubuntu 18.04已经自带了Python 3.x版本,可通过运行:
python3 --version
来查看其对应的版本号,默认情况下是3.6.8版本。
请注意如果运行
python --version
,将会得到2.x版本。因此应使用python3命令来运行python程序
3. 安装及配置pip3
sudo apt-get install python3-pip
在当前用户目录下,配置pip3的安装源为华为云安装源
cd ~
mkdir .pip
cd .pip
vi pip.conf
在文件中输入:
[global]
index-url = http://mirrors.myhuaweicloud.com/pypi/web/simple
format = columns
[install]
trusted-host=mirrors.myhuaweicloud.com
4. 安装numpy
sudo pip3 install numpy
5. 安装matplotlib
(1) 安装freetype2库
wget https://download-mirror.savannah.gnu.org/releases/freetype/freetype-2.10.0.tar.gz
tar -zxvf freetype-2.10.0.tar.gz
./configure
make
sudo make install
到/usr/local/include目录(freetype的默认安装路径)下,把freetype2目录内所有文件和文件夹拷贝到/usr/local/include下:
cd /usr/local/include
sudo cp -r freetype2/* ./
(2)安装libpng库:
sudo apt-get install libpng-dev
(3)安装matplotlib
sudo pip3 install matplotlib
6. 安装scipy
sudo apt-get install liblapack-dev
sudo apt-get install gfortran
sudo pip3 install scipy
7. 安装sklearn
sudo apt-get isntall cython
sudo pip3 install sklearn
8. 安装pandas
sudo pip3 install pandas
9. 安装和配置jupyter
(1)安装jupyter
sudo apt-get install jupyter
注意到编辑本文时为止,似乎无法通过pip3 install jupyter来安装,只能使用apt-get install
(2)生成默认配置文件
cd ~/
jupyter notebook --generate-config
这将自动创建~/.jupyter/jupyter_notebook_config.py配置文件
(3)在配置文件中添加下列内容
c.NotebookApp.ip='0.0.0.0'    # 允许绑定到服务器所有可用IP地址(包括弹性公网IP地址)
c.NotebookApp.open_browser=False    # 不尝试打开服务器上的浏览器
c.NotebookApp.port=8888    # 默认的端口号是8888,可根据情况修改
(4)配置云服务器的安全组,允许8888端口开放
(5)启动jupyter网站
jupyter notebook
如果是root身份登录,则应运行:
jupyter notebook --allow-root
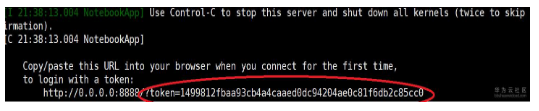
(6)从客户端访问jupyter网站
打开客户都安浏览器,输入:http://弹性公网IP地址:8888/?token=......
其中,token后面按照上一步中显示的字符串输入
此时可以看到jupyter notebook的界面
10. 在jupyter中运行代码
(1)新建一个Python3笔记本页面,输入下列内容:
import numpy as np
import matplotlib.pyplot as plt
%matplotlib inline
x = np.linspace(0,2*np.pi,100)
y = np.sin(x)
plt.plot(x, y)
plt.show()
(2)运行并观察结果

作者:Jerry Zhou