一、说在前面
| 昨天 |
1、创建登入和注册界面;2、向数据库添加一张用户表 |
| 今天 |
用图标显示账单情况 |
|
问题 |
1、使用第三方库 hellochart,时添加依赖构建失败 2、在 chertFragment.java中关联 LineChartView时,报空指针异常 |
第三方库hellochart :https://i-beta.cnblogs.com/posts/edit;postId=12238470
使用指导:https://www.cnblogs.com/huolongluo/p/5988644.html
二、图表展示的构建
1、添加一个展示图表的界面,并添加到navigation中。
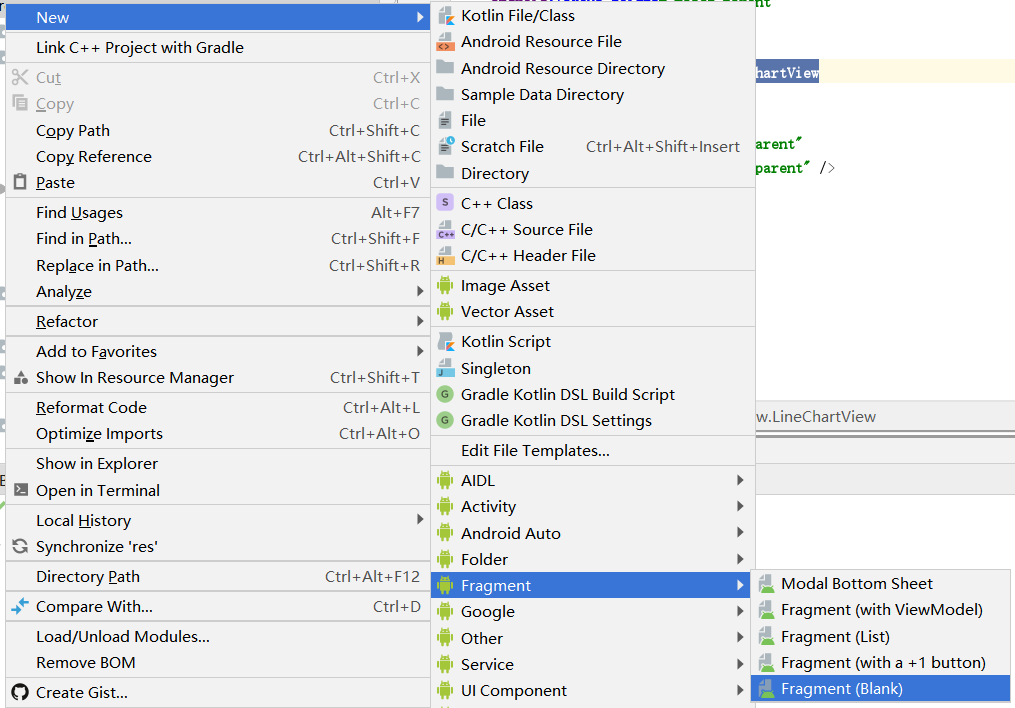
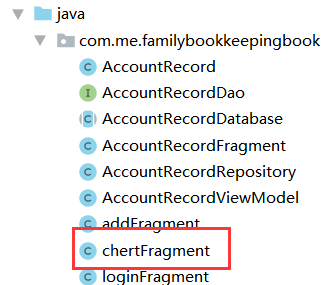
1)创建展示图表的界面
2)添加到navigation中
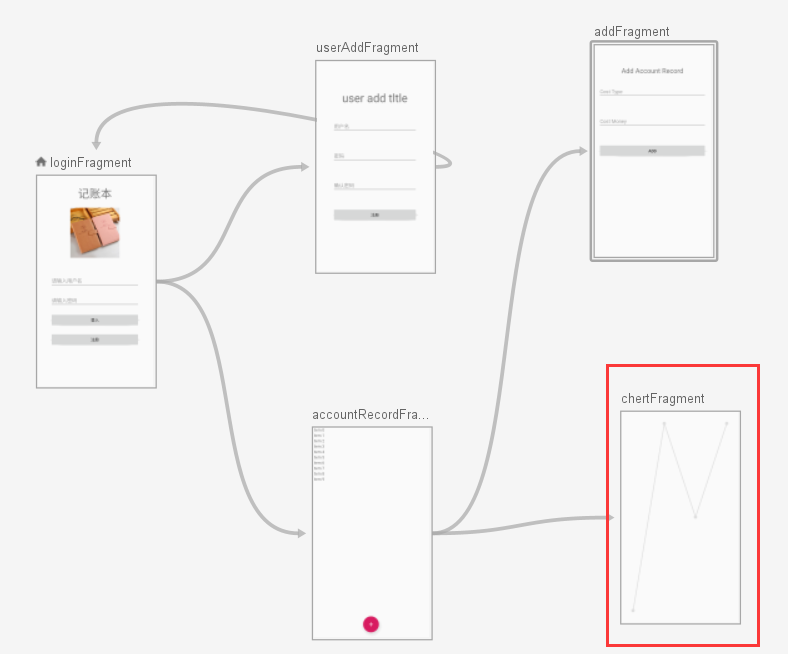
2、确定跳转关系(从账单的卡片列表信息的菜单栏中转到账单图表)
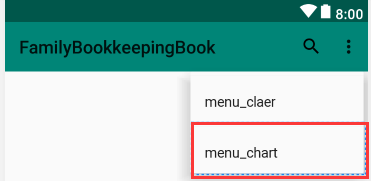
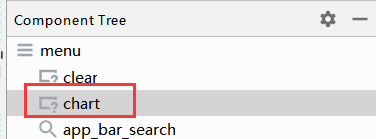
1)在菜单中添加一个menuitem
2)在AccountRecordFragment.java中绑定跳转关系
@Override
    public boolean onOptionsItemSelected(@NonNull MenuItem item) {

        switch (item.getItemId()){
            case R.id.clear:
                AlertDialog.Builder builder = new AlertDialog.Builder(requireActivity());
                builder.setTitle("清空账单");
                builder.setPositiveButton("确定", new DialogInterface.OnClickListener() {
                    @Override
                    public void onClick(DialogInterface dialog, int which) {
                        accountRecordViewModel.deleteAllAccountRecord();
                    }
                });
                builder.setNegativeButton("取消", new DialogInterface.OnClickListener() {
                    @Override
                    public void onClick(DialogInterface dialog, int which) {

                    }
                });
                builder.create();
                builder.show();
                break;
            case R.id.chart:
                NavController navController = Navigation.findNavController(requireActivity(),R.id.fragment4);
                navController.navigate(R.id.action_accountRecordFragment_to_chertFragment);
        }
        return super.onOptionsItemSelected(item);
    }
3、引入第三方库hellochart
解决问题:使用第三方库 hellochart,时添加依赖构建失败
1)第三方库所提供的添加依赖的方式
   dependencies{
        compile 'com.github.lecho:hellocharts-library:1.5.8@aar'
   }
2)可行的添加依赖的方式
implementation 'com.github.lecho:hellocharts-library:1.5.8@aar'
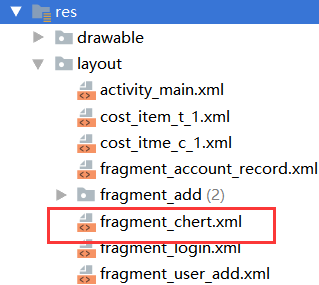
4、搭建图表界面
chartFragment.xml
<?xml version="1.0" encoding="utf-8"?>
<LinearLayout xmlns:android="http://schemas.android.com/apk/res/android"
    android:orientation="vertical" android:layout_width="match_parent"
    android:layout_height="match_parent"
    android:padding="10dp">

    <lecho.lib.hellocharts.view.LineChartView
        android:id="@+id/chart"
        android:padding="20dp"
        android:layout_width="match_parent"
        android:layout_height="match_parent" />

</LinearLayout>
5、图表数据处理和绑定
解决问题:在 chertFragment.java中关联 LineChartView时,报空指针异常
错误方式直接在onCreateView方法中关联组件(编译没错,但是测试这里的时候报空指针异常)
@Override
    public View onCreateView(LayoutInflater inflater, ViewGroup container,
                             Bundle savedInstanceState) {
        // Inflate the layout for this fragment
        mChart = container.findViewById(R.id.chart);
        return inflater.inflate(R.layout.fragment_chert, container, false);
    }
重新onViewCreated方法在这里面绑定
@Override
    public void onViewCreated(@NonNull View view, @Nullable Bundle savedInstanceState) {
        super.onViewCreated(view, savedInstanceState);
        mChart = view.findViewById(R.id.chart);
    }
(注:建议控件的初始化写在onViewCreated而非onCreateView)
1)数据处理
private void generateValues(List<AccountRecord> allDate) {
        if(allDate != null){
            for (int i = 0; i < allDate.size(); i++) {
                AccountRecord costBean = allDate.get(i);
                String costDate = costBean.getCostTime();
                Double costMoney = costBean.getCostMoney();
                mAxisXValues.add(new AxisValue(i).setLabel(costDate));
                if(!table.containsKey(costDate)){
                    table.put(costDate,costMoney.intValue());
                    //mAxisXValues.add(new AxisValue(i).setLabel(costDate));
                }else {
                    int originMoney = table.get(costDate);
                    table.put(costDate,originMoney + costMoney.intValue());
                }
            }
        }
    }
2)坐标轴设置
 private void setAxis() {
        //坐标轴
        Axis axisX = new Axis(); //X轴
        axisX.setHasTiltedLabels(true);  //X坐标轴字体是斜的显示还是直的,true是斜的显示
        axisX.setTextColor(Color.GRAY);  //设置字体颜色
        axisX.setName("日期");  //表格名称
        axisX.setTextSize(10);//设置字体大小
        axisX.setMaxLabelChars(7); //最多几个X轴坐标,意思就是你的缩放让X轴上数据的个数7<=x<=mAxisXValues.length
        axisX.setValues(mAxisXValues);  //填充X轴的坐标名称
        mData.setAxisXBottom(axisX); //x 轴在底部
        //data.setAxisXTop(axisX);  //x 轴在顶部
        axisX.setHasLines(true); //x 轴分割线

        // Y轴是根据数据的大小自动设置Y轴上限(在下面我会给出固定Y轴数据个数的解决方案)
        Axis axisY = new Axis();  //Y轴
        axisY.setName("钱");//y轴标注
        axisY.setTextSize(10);//设置字体大小
        mData.setAxisYLeft(axisY);  //Y轴设置在左边
        //data.setAxisYRight(axisY);  //y轴设置在右边
    }
3)数据绑定和图表的属性设置
private void generateData() {
        List<Line> lines = new ArrayList<>();
        List<PointValue> values = new ArrayList<>();
        int indexX = 0;
        for(Integer value : table.values()){
            values.add(new PointValue(indexX, value));
            indexX++;
        }
        Line line = new Line(values);
        line.setColor(ChartUtils.COLORS[0]);
        line.setShape(ValueShape.CIRCLE);
        line.setPointColor(ChartUtils.COLORS[1]);
        lines.add(line);
        mData.setLines(lines);
        setAxis();
        mChart.setLineChartData(mData);
    }
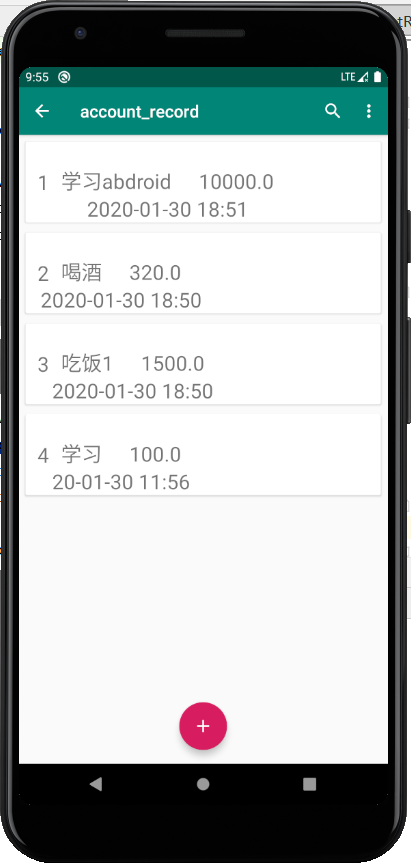
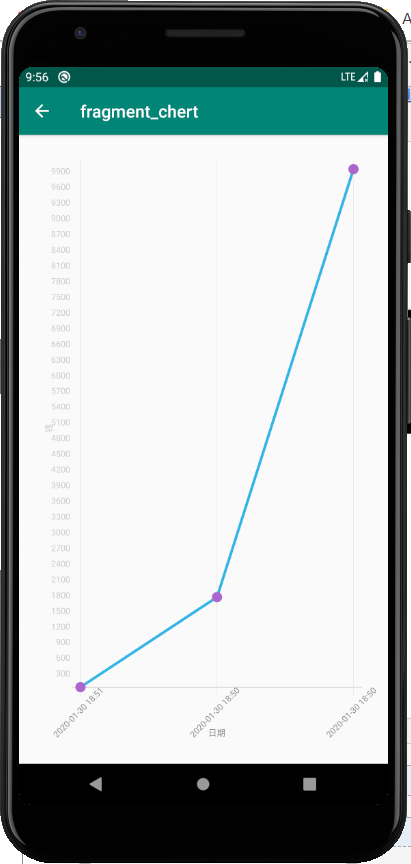
三、运行测试