matplotlib实现三维柱状图
 1 import cv2
 2
 3 img = cv2.imread("1.png", 0)
 4
 5 #特征点在图片中的坐标位置
 6 m = 448
 7 n = 392
 8
 9 import numpy as np
10 import matplotlib.pyplot as plt
11
12 # This import registers the 3D projection, but is otherwise unused.
13 from mpl_toolkits.mplot3d import Axes3D  # noqa: F401 unused import
14
15 # setup the figure and axes
16 fig = plt.figure(figsize=(10, 5))  # 画布宽长比例
17 ax1 = fig.add_subplot(121, projection='3d')
18 ax2 = fig.add_subplot(122, projection='3d')
19 ax1.set_title('Shaded')
20 ax2.set_title("colored")
21
22 # fake data
23 _x = np.arange(444, 453)
24 _y = np.arange(388, 397)
25 _xx, _yy = np.meshgrid(_x, _y)
26 x, y = _xx.ravel(), _yy.ravel()#ravel扁平化
27 # 函数
28 top = []
29 for i in range(-4, 5):
30     for j in range(-4, 5):
31         top.append(img[i+n][j+m])
32
33 bottom = np.zeros_like(top)#每个柱的起始位置
34 width = depth = 1#x,y方向的宽厚
35
36 ax1.bar3d(x, y, bottom, width, depth, top, shade=True)  #x,y为数组
37
38 ax1.set_xlabel('X')
39 ax1.set_ylabel('Y')
40 ax1.set_zlabel('pixel value')
41
42 for i in range(-4, 5):
43     for j in range(-4, 5):
44         z = img[i+n][j+m] #该柱的高
45         color = np.array([255, 255, z])/255.0#颜色 其中每个元素在0~1之间
46         ax2.bar3d(j+m, i+n, 0, width, depth, z, color=color)   #每次画一个柱
47
48 ax2.set_xlabel('X')
49 ax2.set_ylabel('Y')
50 ax2.set_zlabel('pixel value')
51 plt.show()
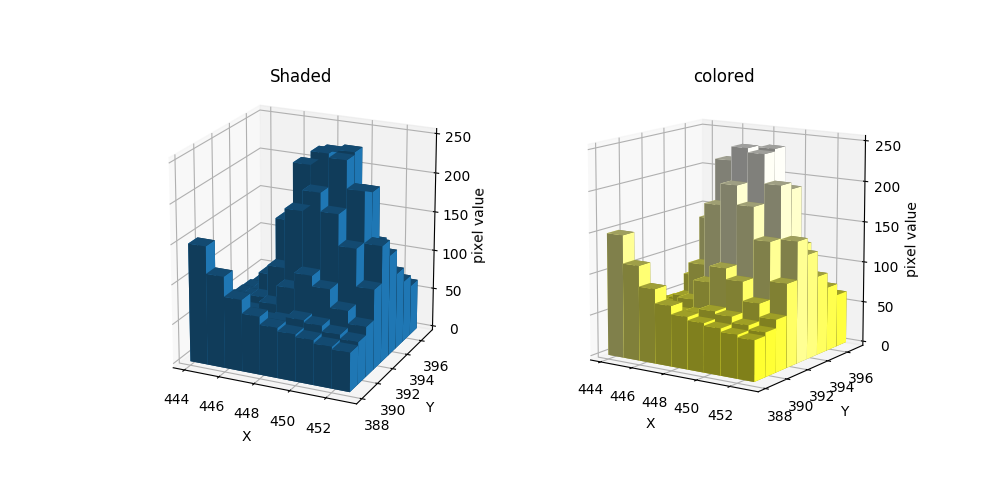
以上程序将特征点周围四个像素的像素点三维化,ax1用数组的方式画柱状图,同时绘制多个柱。ax2用数值的方式画柱状图,每次画一个柱。
结果: