Grafana
官网地址:Grafana
官方文档:Grafana文档
Grafana是一个跨平台的开源的度量分析和可视化工具,可以通过将采集的数据查询然后可视化的展示,并及时通知。它主要有以下六大特点:
1、展示方式:快速灵活的客户端图表,面板插件有许多不同方式的可视化指标和日志,官方库中具有丰富的仪表盘插件,比如热图、折线图、图表等多种展示方式;
2、数据源:Graphite,InfluxDB,OpenTSDB,Prometheus,Elasticsearch,CloudWatch和KairosDB等;
3、通知提醒:以可视方式定义最重要指标的警报规则,Grafana将不断计算并发送通知,在数据达到阈值时通过Slack、PagerDuty等获得通知;
4、混合展示:在同一图表中混合使用不同的数据源,可以基于每个查询指定数据源,甚至自定义数据源;
5、注释:使用来自不同数据源的丰富事件注释图表,将鼠标悬停在事件上会显示完整的事件元数据和标记;
6、过滤器:Ad-hoc过滤器允许动态创建新的键/值过滤器,这些过滤器会自动应用于使用该数据源的所有查询。
快速开始
查找镜像
docker search grafana/grafana
拉取容器镜像
docker pull grafana/grafana
查看容器
docker images
启动容器
docker run -d --name grafana -p 3000:3000 grafana/grafana:master
Grafana的配置文件为:(/etc/grafana/grafana.ini),进入容器:docker exec -it grafana bash
访问
http://公网ip:3000
注意:默认用户和密码:admin:admin
prometheus
Prometheus是一个开源的服务监控系统,它通过HTTP协议从远程的机器收集数据并存储在本地的时序数据库上。
- 多维数据模型(时序列数据由metric名和一组key/value组成)
- 在多维度上灵活的查询语言(PromQl)
- 不依赖分布式存储,单主节点工作.
- 通过基于HTTP的pull方式采集时序数据
- 可以通过push gateway进行时序列数据推送(pushing)
- 可以通过服务发现或者静态配置去获取要采集的目标服务器
- 多种可视化图表及仪表盘支持
- Prometheus通过安装在远程机器上的exporter来收集监控数据,后面我们将使用到node_exporter收集系统数据。
快速开始
docker pull prom/node-exporter
docker pull prom/prometheus
启动node-exporter:这个exporter是采集主机信息的
docker run -d -p 9100:9100
  -v "/proc:/host/proc:ro"
  -v "/sys:/host/sys:ro"
  -v "/:/rootfs:ro"
  --net="host"
  prom/node-exporter
访问url
http://公网ip:9100/metrics
新建目录prometheus,编辑配置文件prometheus.yml
mkdir /home/prometheus
cd /home/prometheus
vim prometheus.yml
global:
  scrape_interval:     60s
  evaluation_interval: 60s

scrape_configs:
  - job_name: prometheus
    static_configs:
      - targets: ['localhost:9090']
        labels:
          instance: prometheus

  - job_name: linux
    static_configs:
      - targets: ['公网ip:9100']
        labels:
          instance: localhost
启动prometheus
docker run  -d
  -p 9090:9090
  -v /home/prometheus/prometheus.yml:/etc/prometheus/prometheus.yml
  prom/prometheus
访问url
http://公网ip:9090/graph
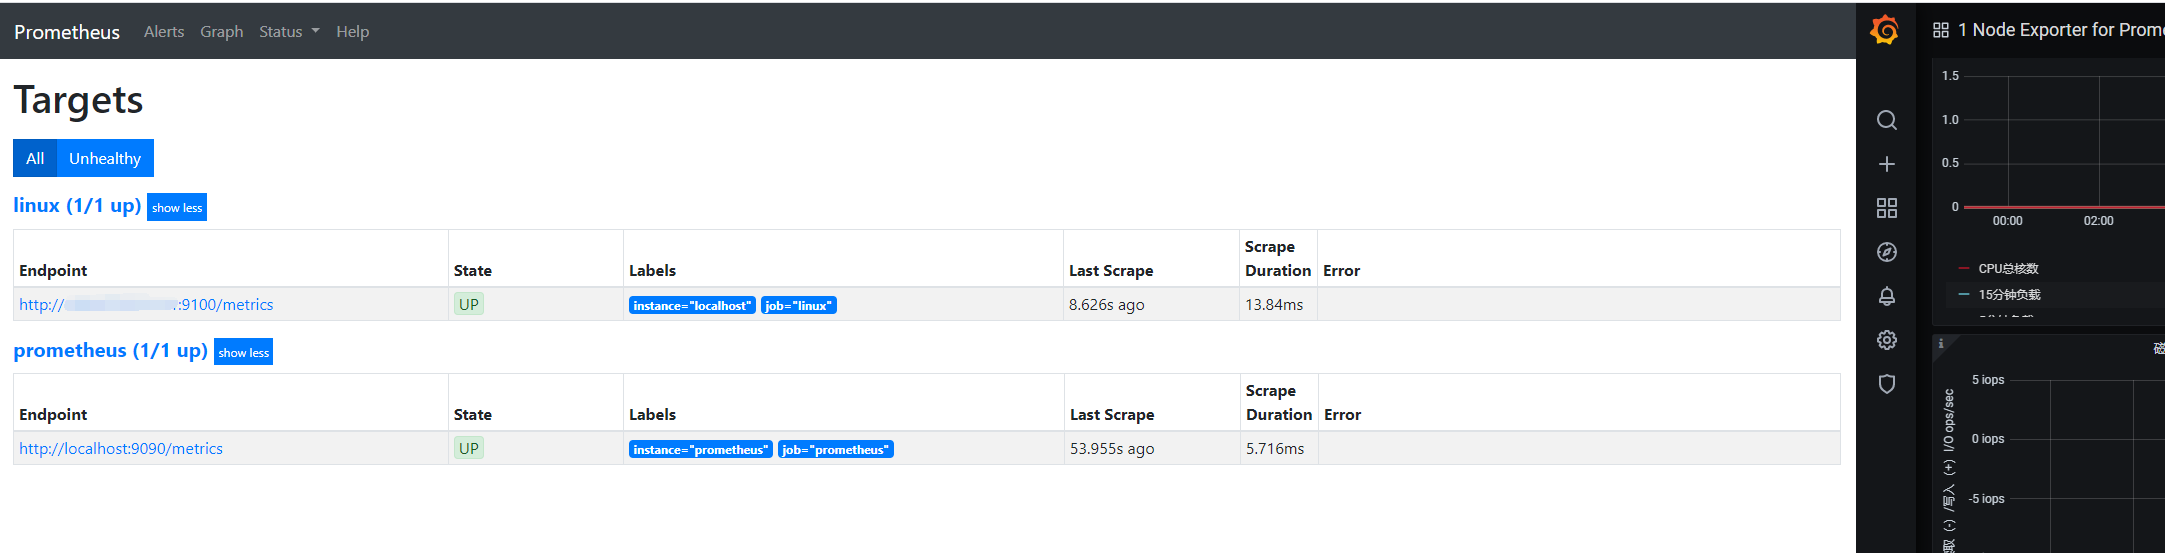
访问targets
http://公网ip:9090/targets
快速使用
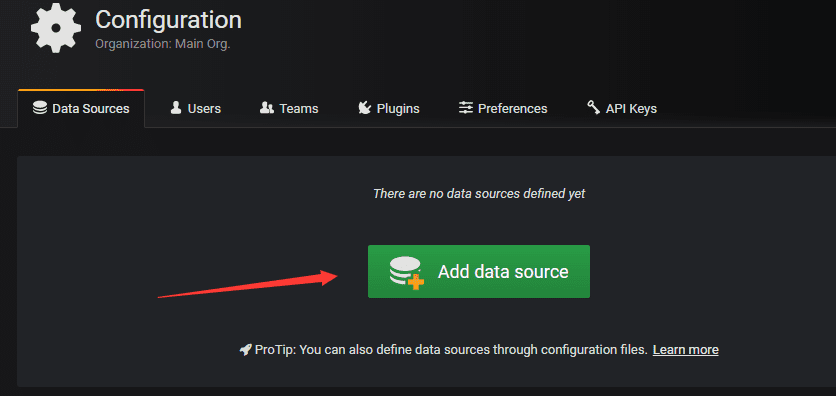
1、添加Prometheus数据源

Add data source选择Prometheus
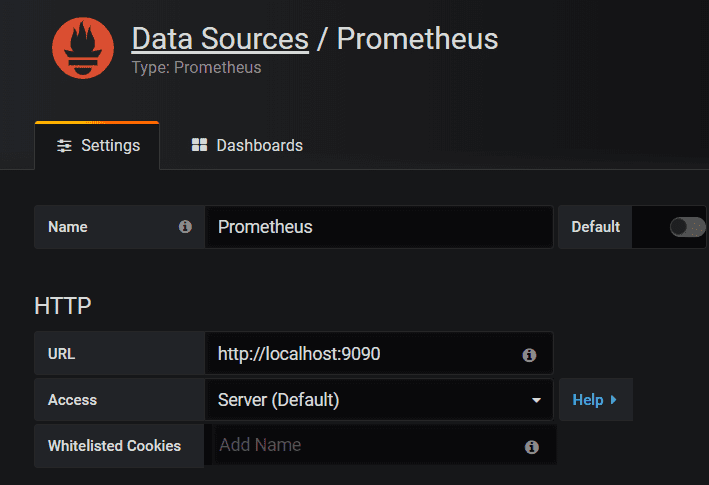
- Name名字写Prometheus
- 如果有type 的话选择Prometheus,因为数据都从它那里获取
- URL输入Prometheus的ip+端口
点击下面的Save & Test,如果出现绿色的,说明ok了

至此Prometheus和Grafana已经打通了,接下来需要添加个图形模板以便展示数据。
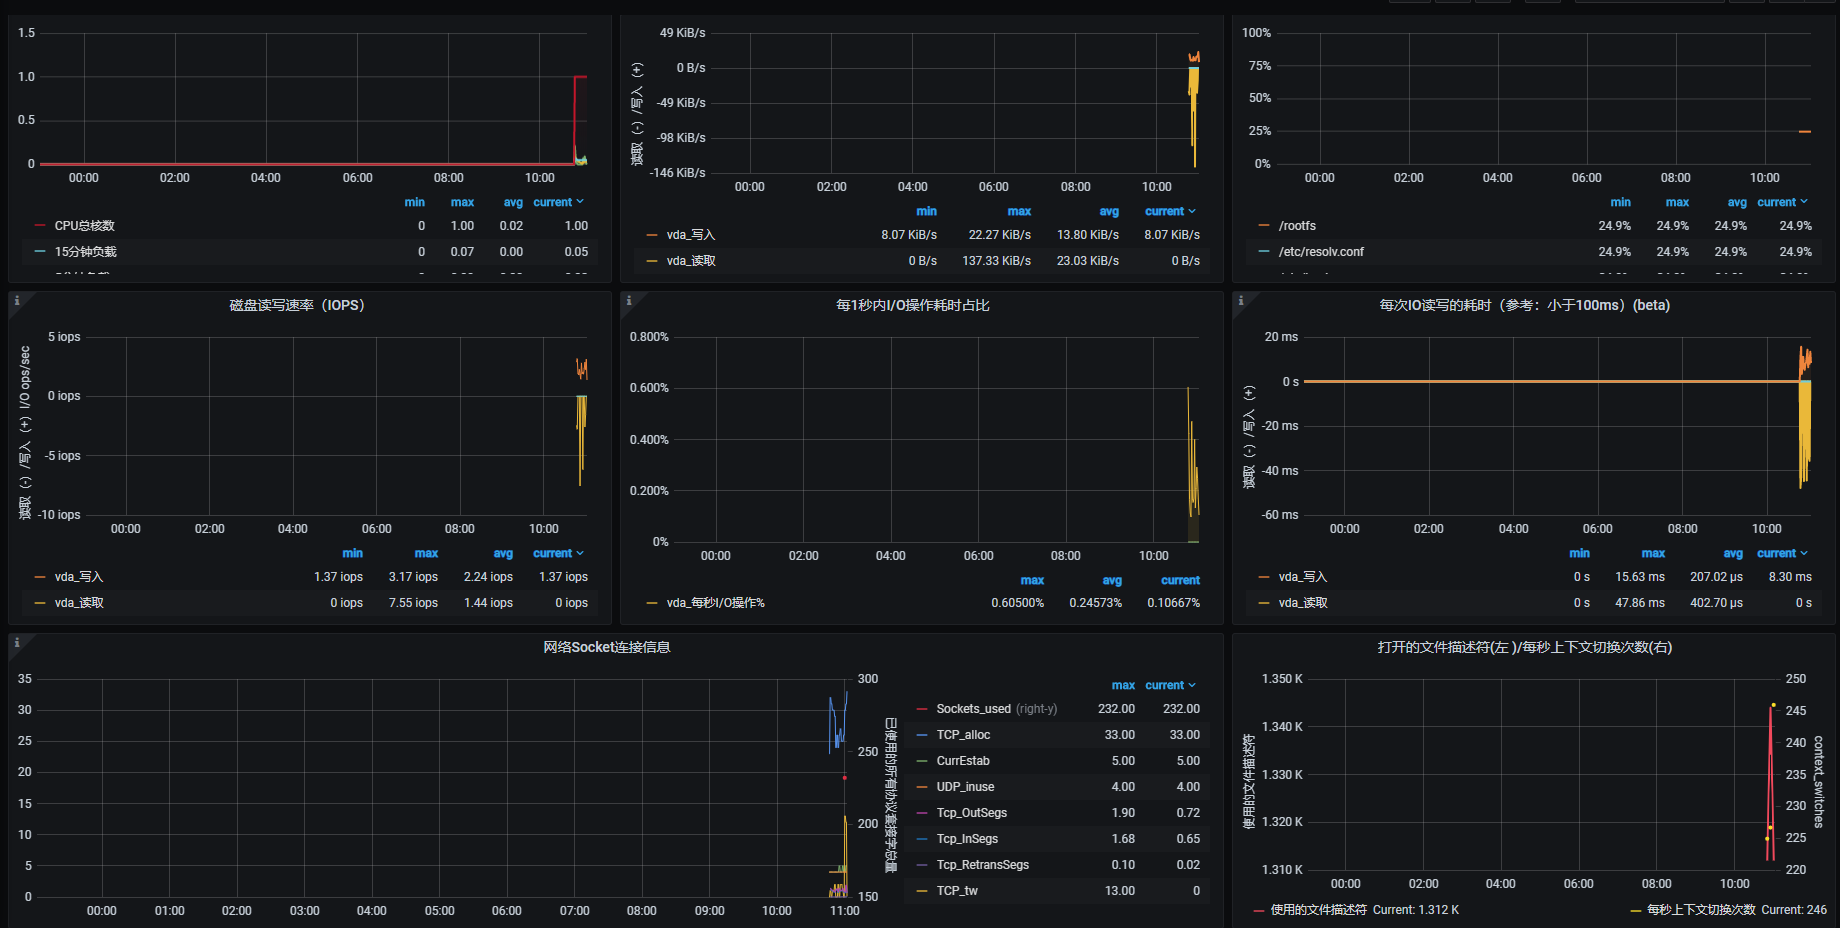
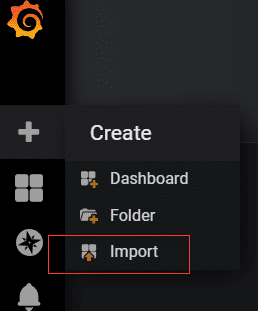
Grafana里有很多的模板可以直接使用(https://grafana.com/dashboards),我这里使用的是https://grafana.com/dashboards/8919,其中8919是ID号,可以在Grafana中Import,直接输入ID号会自动找到该模板。
3.展示监控主机的ui