README.adoc


Spring Cloud Sleuth
Spring Cloud Sleuth is a distributed tracing tool for Spring Cloud. It borrows from Dapper, Zipkin, and HTrace.
Quick Start
Add sleuth to the classpath of a Spring Boot application (see “Adding Sleuth to the Project” for Maven and Gradle examples), and you can see the correlation data being collected in logs, as long as you are logging requests.
For example, consider the following HTTP handler:
@RestController public class DemoController { private static Logger log = LoggerFactory.getLogger(DemoController.class); @RequestMapping("/") public String home() { log.info("Handling home"); ... return "Hello World"; } }
If you add that handler to a controller, you can see the calls to home() being traced in the logs and in Zipkin, if Zipkin is configured.
Note | Instead of logging the request in the handler explicitly, you could set logging.level.org.springframework.web.servlet.DispatcherServlet=DEBUG. |
Note | Set spring.application.name=myService (for instance) to see the service name as well as the trace and span IDs. |
Important | If you use Zipkin, configure the probability of spans exported by setting spring.sleuth.sampler.probability (default: 0.1, which is 10 percent). Otherwise, you might think that Sleuth is not working be cause it omits some spans. |
Introduction
Spring Cloud Sleuth implements a distributed tracing solution for Spring Cloud.
Terminology
Spring Cloud Sleuth borrows Dapper’s terminology.
Span: The basic unit of work. For example, sending an RPC is a new span, as is sending a response to an RPC. Spans are identified by a unique 64-bit ID for the span and another 64-bit ID for the trace the span is a part of. Spans also have other data, such as descriptions, timestamped events, key-value annotations (tags), the ID of the span that caused them, and process IDs (normally IP addresses).
Spans can be started and stopped, and they keep track of their timing information. Once you create a span, you must stop it at some point in the future.
Tip | The initial span that starts a trace is called a root span. The value of the ID of that span is equal to the trace ID. |
Trace: A set of spans forming a tree-like structure. For example, if you run a distributed big-data store, a trace might be formed by a PUT request.
Annotation: Used to record the existence of an event in time. With Brave instrumentation, we no longer need to set special events for Zipkin to understand who the client and server are, where the request started, and where it ended. For learning purposes, however, we mark these events to highlight what kind of an action took place.
cs: Client Sent. The client has made a request. This annotation indicates the start of the span.
sr: Server Received: The server side got the request and started processing it. Subtracting the
cstimestamp from this timestamp reveals the network latency.ss: Server Sent. Annotated upon completion of request processing (when the response got sent back to the client). Subtracting the
srtimestamp from this timestamp reveals the time needed by the server side to process the request.cr> Client Received. Signifies the end of the span. The client has successfully received the response from the server side. Subtracting the
cstimestamp from this timestamp reveals the whole time needed by the client to receive the response from the server.
The following image shows how Span and Trace look in a system, together with the Zipkin annotations:

Each color of a note signifies a span (there are seven spans - from A to G). Consider the following note:
Trace Id = X Span Id = D Client SentThis note indicats thatthe current span has Trace Id set to X and Span Id set to D. Also, the Client Sent event took place.
The following image shows how parent-child relationships of spans look:

Purpose
The following sections refer to the example shown in the preceding image.
Distributed Tracing with Zipkin
This example has seven spans. If you go to traces in Zipkin, you can see this number in the second trace, as shown in the following image:

However, if you pick a particular trace, you can see four spans, as shown in the following image:

Note | When you pick a particular trace, you see merged spans. That means that, if there were two spans sent to Zipkin with Server Received and Server Sent or Client Received and Client Sent annotations, they are presented as a single span. |
Why is there a difference between the seven and four spans in this case?
Two spans come from the
http:/startspan. It has the Server Received (sr) and Server Sent (ss) annotations.Two spans come from the RPC call from
service1toservice2to thehttp:/fooendpoint. The Client Sent (cs) and Client Received (cr) events took place on theservice1side. Server Received (sr) and Server Sent (ss) events took place on theservice2side. These two spans form one logical span related to an RPC call.Two spans come from the RPC call from
service2toservice3to thehttp:/barendpoint. The Client Sent (cs) and Client Received (cr) events took place on theservice2side. The Server Received (sr) and Server Sent (ss) events took place on theservice3side. These two spans form one logical span related to an RPC call.Two spans come from the RPC call from
service2toservice4to thehttp:/bazendpoint. The Client Sent (cs) and Client Received (cr) events took place on theservice2side. Server Received (sr) and Server Sent (ss) events took place on theservice4side. These two spans form one logical span related to an RPC call.
So, if we count the physical spans, we have one from http:/start, two from service1 calling service2, two from service2 calling service3, and two from service2 calling service4. In sum, we have a total of seven spans.
Logically, we see the information of four total Spans because we have one span related to the incoming request to service1 and three spans related to RPC calls.
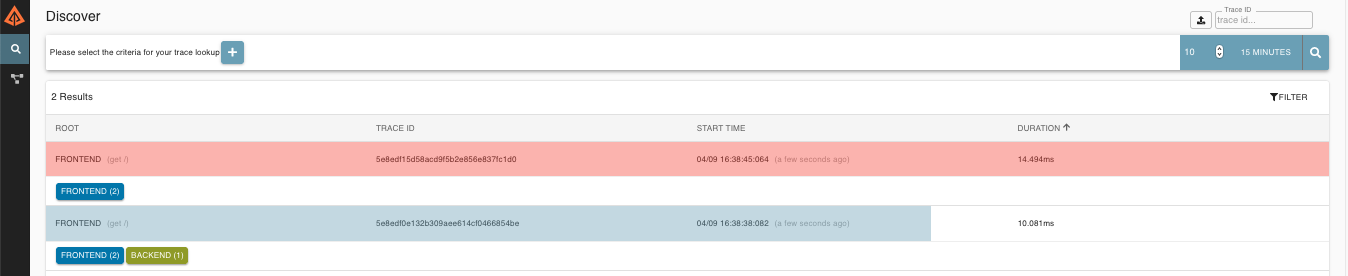
Visualizing errors
Zipkin lets you visualize errors in your trace. When an exception was thrown and was not caught, we set proper tags on the span, which Zipkin can then properly colorize. You could see in the list of traces one trace that is red. That appears because an exception was thrown.
If you click that trace, you see a similar picture, as follows:
If you then click on one of the spans, you see the following
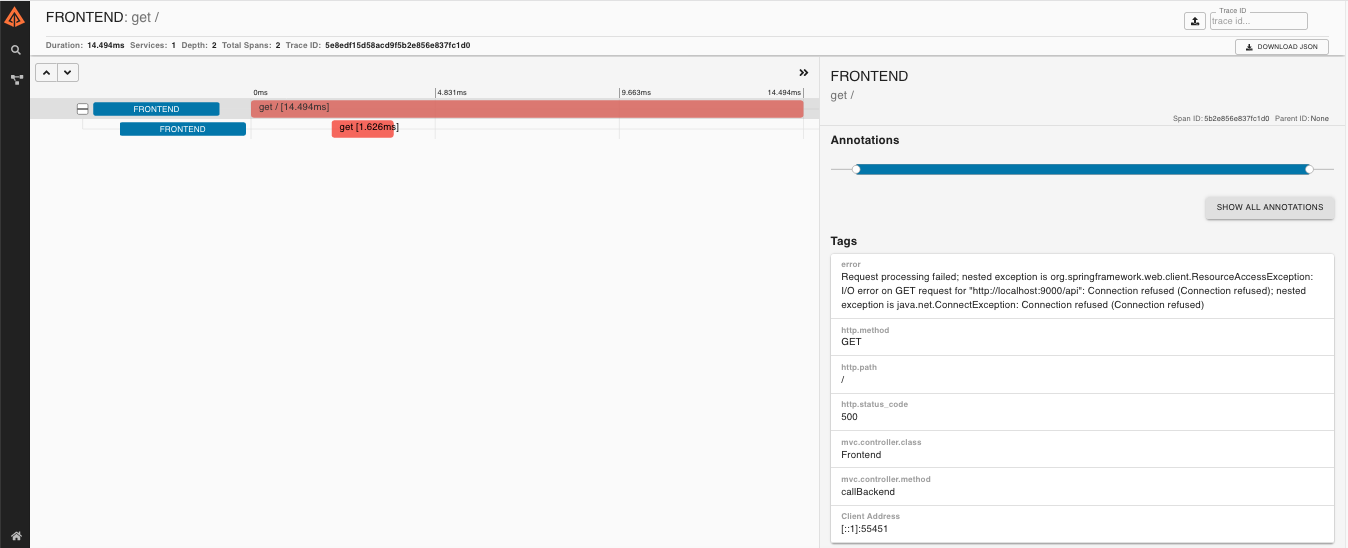
The span shows the reason for the error and the whole stack trace related to it.
Distributed Tracing with Brave
Starting with version 2.0.0, Spring Cloud Sleuth uses Brave as the tracing library. Consequently, Sleuth no longer takes care of storing the context but delegates that work to Brave.
Due to the fact that Sleuth had different naming and tagging conventions than Brave, we decided to follow Brave’s conventions from now on. However, if you want to use the legacy Sleuth approaches, you can set the spring.sleuth.http.legacy.enabled property to true.
Live examples

The dependency graph in Zipkin should resemble the following image:

Log correlation
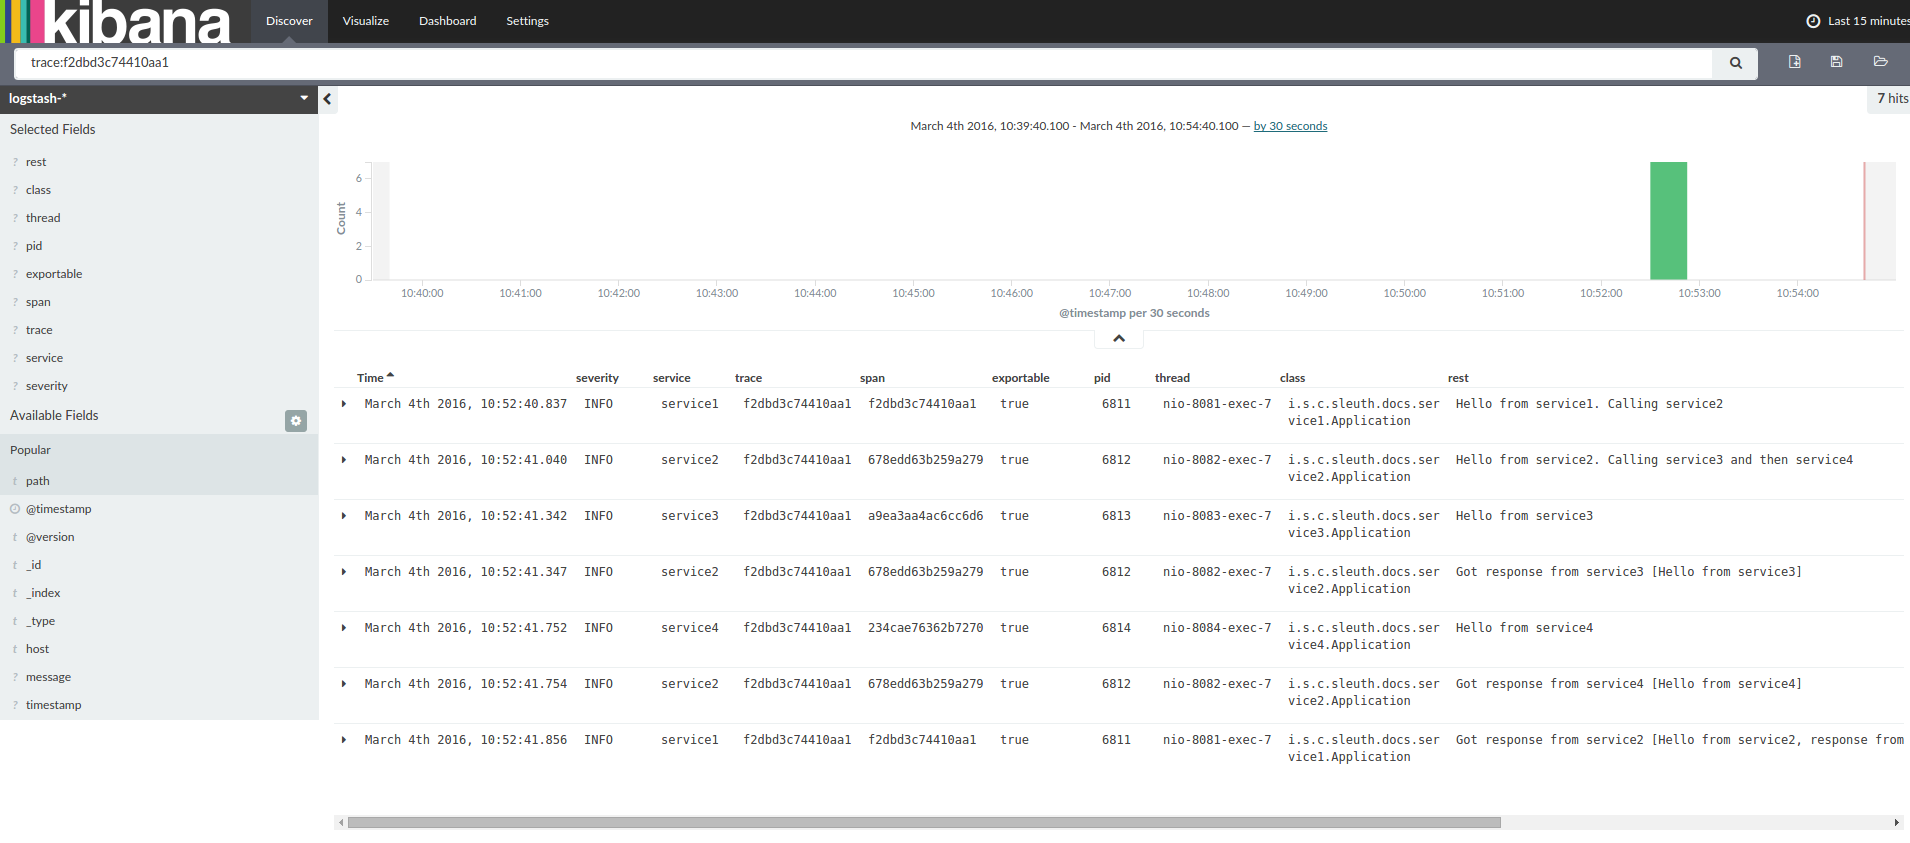
When using grep to read the logs of those four applications by scanning for a trace ID equal to (for example) 2485ec27856c56f4, you get output resembling the following:
service1.log:2016-02-26 11:15:47.561 INFO [service1,2485ec27856c56f4,2485ec27856c56f4,true] 68058 --- [nio-8081-exec-1] i.s.c.sleuth.docs.service1.Application : Hello from service1. Calling service2 service2.log:2016-02-26 11:15:47.710 INFO [service2,2485ec27856c56f4,9aa10ee6fbde75fa,true] 68059 --- [nio-8082-exec-1] i.s.c.sleuth.docs.service2.Application : Hello from service2. Calling service3 and then service4 service3.log:2016-02-26 11:15:47.895 INFO [service3,2485ec27856c56f4,1210be13194bfe5,true] 68060 --- [nio-8083-exec-1] i.s.c.sleuth.docs.service3.Application : Hello from service3 service2.log:2016-02-26 11:15:47.924 INFO [service2,2485ec27856c56f4,9aa10ee6fbde75fa,true] 68059 --- [nio-8082-exec-1] i.s.c.sleuth.docs.service2.Application : Got response from service3 [Hello from service3] service4.log:2016-02-26 11:15:48.134 INFO [service4,2485ec27856c56f4,1b1845262ffba49d,true] 68061 --- [nio-8084-exec-1] i.s.c.sleuth.docs.service4.Application : Hello from service4 service2.log:2016-02-26 11:15:48.156 INFO [service2,2485ec27856c56f4,9aa10ee6fbde75fa,true] 68059 --- [nio-8082-exec-1] i.s.c.sleuth.docs.service2.Application : Got response from service4 [Hello from service4] service1.log:2016-02-26 11:15:48.182 INFO [service1,2485ec27856c56f4,2485ec27856c56f4,true] 68058 --- [nio-8081-exec-1] i.s.c.sleuth.docs.service1.Application : Got response from service2 [Hello from service2, response from service3 [Hello from service3] and from service4 [Hello from service4]]If you use a log aggregating tool (such as Kibana, Splunk, and others), you can order the events that took place. An example from Kibana would resemble the following image:
If you want to use Logstash, the following listing shows the Grok pattern for Logstash:
filter { # pattern matching logback pattern grok { match => { "message" => "%{TIMESTAMP_ISO8601:timestamp}s+%{LOGLEVEL:severity}s+[%{DATA:service},%{DATA:trace},%{DATA:span},%{DATA:exportable}]s+%{DATA:pid}s+---s+[%{DATA:thread}]s+%{DATA:class}s+:s+%{GREEDYDATA:rest}" } } }Note | If you want to use Grok together with the logs from Cloud Foundry, you have to use the following pattern: |
filter { # pattern matching logback pattern grok { match => { "message" => "(?m)OUTs+%{TIMESTAMP_ISO8601:timestamp}s+%{LOGLEVEL:severity}s+[%{DATA:service},%{DATA:trace},%{DATA:span},%{DATA:exportable}]s+%{DATA:pid}s+---s+[%{DATA:thread}]s+%{DATA:class}s+:s+%{GREEDYDATA:rest}" } } }JSON Logback with Logstash
Often, you do not want to store your logs in a text file but in a JSON file that Logstash can immediately pick. To do so, you have to do the following (for readability, we pass the dependencies in the groupId:artifactId:version notation).
Dependencies Setup
Ensure that Logback is on the classpath (
ch.qos.logback:logback-core).Add Logstash Logback encode. For example, to use version
4.6, addnet.logstash.logback:logstash-logback-encoder:4.6.
Logback Setup
Consider the following example of a Logback configuration file (named logback-spring.xml).
<?xml version="1.0" encoding="UTF-8"?> <configuration> <include resource="org/springframework/boot/logging/logback/defaults.xml"/> <springProperty scope="context" name="springAppName" source="spring.application.name"/> <!-- Example for logging into the build folder of your project --> <property name="LOG_FILE" value="${BUILD_FOLDER:-build}/${springAppName}"/> <!-- You can override this to have a custom pattern --> <property name="CONSOLE_LOG_PATTERN" value="%clr(%d{yyyy-MM-dd HH:mm:ss.SSS}){faint} %clr(${LOG_LEVEL_PATTERN:-%5p}) %clr(${PID:- }){magenta} %clr(---){faint} %clr([%15.15t]){faint} %clr(%-40.40logger{39}){cyan} %clr(:){faint} %m%n${LOG_EXCEPTION_CONVERSION_WORD:-%wEx}"/> <!-- Appender to log to console --> <appender name="console" class="ch.qos.logback.core.ConsoleAppender"> <filter class="ch.qos.logback.classic.filter.ThresholdFilter"> <!-- Minimum logging level to be presented in the console logs--> <level>DEBUG</level> </filter> <encoder> <pattern>${CONSOLE_LOG_PATTERN}</pattern> <charset>utf8</charset> </encoder> </appender> <!-- Appender to log to file --> <appender name="flatfile" class="ch.qos.logback.core.rolling.RollingFileAppender"> <file>${LOG_FILE}</file> <rollingPolicy class="ch.qos.logback.core.rolling.TimeBasedRollingPolicy"> <fileNamePattern>${LOG_FILE}.%d{yyyy-MM-dd}.gz</fileNamePattern> <maxHistory>7</maxHistory> </rollingPolicy> <encoder> <pattern>${CONSOLE_LOG_PATTERN}</pattern> <charset>utf8</charset> </encoder> </appender> <!-- Appender to log to file in a JSON format --> <appender name="logstash" class="ch.qos.logback.core.rolling.RollingFileAppender"> <file>${LOG_FILE}.json</file> <rollingPolicy class="ch.qos.logback.core.rolling.TimeBasedRollingPolicy"> <fileNamePattern>${LOG_FILE}.json.%d{yyyy-MM-dd}.gz</fileNamePattern> <maxHistory>7</maxHistory> </rollingPolicy> <encoder class="net.logstash.logback.encoder.LoggingEventCompositeJsonEncoder"> <providers> <timestamp> <timeZone>UTC</timeZone> </timestamp> <pattern> <pattern> { "severity": "%level", "service": "${springAppName:-}", "trace": "%X{X-B3-TraceId:-}", "span": "%X{X-B3-SpanId:-}", "parent": "%X{X-B3-ParentSpanId:-}", "exportable": "%X{X-Span-Export:-}", "pid": "${PID:-}", "thread": "%thread", "class": "%logger{40}", "rest": "%message" } </pattern> </pattern> </providers> </encoder> </appender> <root level="INFO"> <appender-ref ref="console"/> <!-- uncomment this to have also JSON logs --> <!--<appender-ref ref="logstash"/>--> <!--<appender-ref ref="flatfile"/>--> </root> </configuration>
That Logback configuration file:
Logs information from the application in a JSON format to a
build/${spring.application.name}.jsonfile.Has commented out two additional appenders: console and standard log file.
Has the same logging pattern as the one presented in the previous section.
Note | If you use a custom logback-spring.xml, you must pass the spring.application.name in the bootstraprather than the application property file. Otherwise, your custom logback file does not properly read the property. |
Propagating Span Context
The span context is the state that must get propagated to any child spans across process boundaries. Part of the Span Context is the Baggage. The trace and span IDs are a required part of the span context. Baggage is an optional part.
Baggage is a set of key:value pairs stored in the span context. Baggage travels together with the trace and is attached to every span. Spring Cloud Sleuth understands that a header is baggage-related if the HTTP header is prefixed with baggage- and, for messaging, it starts with baggage_.
Important | There is currently no limitation of the count or size of baggage items. However, keep in mind that too many can decrease system throughput or increase RPC latency. In extreme cases, too much baggage can crash the application, due to exceeding transport-level message or header capacity. |
The following example shows setting baggage on a span:
Span initialSpan = this.tracer.nextSpan().name("span").start(); try (Tracer.SpanInScope ws = this.tracer.withSpanInScope(initialSpan)) { ExtraFieldPropagation.set("foo", "bar"); ExtraFieldPropagation.set("UPPER_CASE", "someValue"); }
Baggage versus Span Tags
Baggage travels with the trace (every child span contains the baggage of its parent). Zipkin has no knowledge of baggage and does not receive that information.
Tags are attached to a specific span. In other words, they are presented only for that particular span. However, you can search by tag to find the trace, assuming a span having the searched tag value exists.
If you want to be able to lookup a span based on baggage, you should add a corresponding entry as a tag in the root span.
Important | The span must be in scope. |
The following listing shows integration tests that use baggage:
initialSpan.tag("foo", ExtraFieldPropagation.get(initialSpan.context(), "foo")); initialSpan.tag("UPPER_CASE", ExtraFieldPropagation.get(initialSpan.context(), "UPPER_CASE"));
Adding Sleuth to the Project
This section addresses how to add Sleuth to your project with either Maven or Gradle.
Important | To ensure that your application name is properly displayed in Zipkin, set the spring.application.nameproperty in bootstrap.yml. |
Only Sleuth (log correlation)
If you want to use only Spring Cloud Sleuth without the Zipkin integration, add the spring-cloud-starter-sleuth module to your project.
The following example shows how to add Sleuth with Maven:
<dependencyManagement> (1) <dependencies> <dependency> <groupId>org.springframework.cloud</groupId> <artifactId>spring-cloud-dependencies</artifactId> <version>${release.train.version}</version> <type>pom</type> <scope>import</scope> </dependency> </dependencies> </dependencyManagement> <dependency> (2) <groupId>org.springframework.cloud</groupId> <artifactId>spring-cloud-starter-sleuth</artifactId> </dependency>
We recommend that you add the dependency management through the Spring BOM so that you need not manage versions yourself.
Add the dependency to
spring-cloud-starter-sleuth.
The following example shows how to add Sleuth with Gradle:
dependencyManagement { (1) imports { mavenBom "org.springframework.cloud:spring-cloud-dependencies:${releaseTrainVersion}" } } dependencies { (2) compile "org.springframework.cloud:spring-cloud-starter-sleuth" }We recommend that you add the dependency management through the Spring BOM so that you need not manage versions yourself.
Add the dependency to
spring-cloud-starter-sleuth.
Sleuth with Zipkin via HTTP
If you want both Sleuth and Zipkin, add the spring-cloud-starter-zipkin dependency.
The following example shows how to do so for Maven:
<dependencyManagement> (1) <dependencies> <dependency> <groupId>org.springframework.cloud</groupId> <artifactId>spring-cloud-dependencies</artifactId> <version>${release.train.version}</version> <type>pom</type> <scope>import</scope> </dependency> </dependencies> </dependencyManagement> <dependency> (2) <groupId>org.springframework.cloud</groupId> <artifactId>spring-cloud-starter-zipkin</artifactId> </dependency>
We recommend that you add the dependency management through the Spring BOM so that you need not manage versions yourself.
Add the dependency to
spring-cloud-starter-zipkin.
The following example shows how to do so for Gradle:
dependencyManagement { (1) imports { mavenBom "org.springframework.cloud:spring-cloud-dependencies:${releaseTrainVersion}" } } dependencies { (2) compile "org.springframework.cloud:spring-cloud-starter-zipkin" }We recommend that you add the dependency management through the Spring BOM so that you need not manage versions yourself.
Add the dependency to
spring-cloud-starter-zipkin.
Sleuth with Zipkin over RabbitMQ or Kafka
If you want to use RabbitMQ or Kafka instead of HTTP, add the spring-rabbit or spring-kafka dependency. The default destination name is zipkin.
Caution | spring-cloud-sleuth-stream is deprecated and incompatible with these destinations. |
If you want Sleuth over RabbitMQ, add the spring-cloud-starter-zipkin and spring-rabbit dependencies.
The following example shows how to do so for Gradle:
<dependencyManagement> (1) <dependencies> <dependency> <groupId>org.springframework.cloud</groupId> <artifactId>spring-cloud-dependencies</artifactId> <version>${release.train.version}</version> <type>pom</type> <scope>import</scope> </dependency> </dependencies> </dependencyManagement> <dependency> (2) <groupId>org.springframework.cloud</groupId> <artifactId>spring-cloud-starter-zipkin</artifactId> </dependency> <dependency> (3) <groupId>org.springframework.amqp</groupId> <artifactId>spring-rabbit</artifactId> </dependency>
We recommend that you add the dependency management through the Spring BOM so that you need not manage versions yourself.
Add the dependency to
spring-cloud-starter-zipkin. That way, all nested dependencies get downloaded.To automatically configure RabbitMQ, add the
spring-rabbitdependency.
dependencyManagement { (1) imports { mavenBom "org.springframework.cloud:spring-cloud-dependencies:${releaseTrainVersion}" } } dependencies { compile "org.springframework.cloud:spring-cloud-starter-zipkin" (2) compile "org.springframework.amqp:spring-rabbit" (3) }We recommend that you add the dependency management through the Spring BOM so that you need not manage versions yourself.
Add the dependency to
spring-cloud-starter-zipkin. That way, all nested dependencies get downloaded.To automatically configure RabbitMQ, add the
spring-rabbitdependency.
Additional Resources
You can watch a video of Marcin Grzejszczak talking about Spring Cloud Sleuth and Zipkin:
Features
Adds trace and span IDs to the Slf4J MDC, so you can extract all the logs from a given trace or span in a log aggregator, as shown in the following example logs:
2016-02-02 15:30:57.902 INFO [bar,6bfd228dc00d216b,6bfd228dc00d216b,false] 23030 --- [nio-8081-exec-3] ... 2016-02-02 15:30:58.372 ERROR [bar,6bfd228dc00d216b,6bfd228dc00d216b,false] 23030 --- [nio-8081-exec-3] ... 2016-02-02 15:31:01.936 INFO [bar,46ab0d418373cbc9,46ab0d418373cbc9,false] 23030 --- [nio-8081-exec-4] ...
Notice the
[appname,traceId,spanId,exportable]entries from the MDC:spanId: The ID of a specific operation that took place.appname: The name of the application that logged the span.traceId: The ID of the latency graph that contains the span.exportable: Whether the log should be exported to Zipkin. When would you like the span not to be exportable? When you want to wrap some operation in a Span and have it written to the logs only.
Provides an abstraction over common distributed tracing data models: traces, spans (forming a DAG), annotations, and key-value annotations. Spring Cloud Slwuth is loosely based on HTrace but is compatible with Zipkin (Dapper).
Sleuth records timing information to aid in latency analysis. By using sleuth, you can pinpoint causes of latency in your applications.
Sleuth is written to not log too much and to not cause your production application to crash. To that end, Sleuth:
Propagates structural data about your call graph in-band and the rest out-of-band.
Includes opinionated instrumentation of layers such as HTTP.
Includes a sampling policy to manage volume.
Can report to a Zipkin system for query and visualization.
Instruments common ingress and egress points from Spring applications (servlet filter, async endpoints, rest template, scheduled actions, message channels, Zuul filters, and Feign client).
Sleuth includes default logic to join a trace across HTTP or messaging boundaries. For example, HTTP propagation works over Zipkin-compatible request headers. This propagation logic is defined and customized through
SpanInjectorandSpanExtractorimplementations.Sleuth can propagate context (also known as baggage) between processes. Consequently, if you set a baggage element on a Span, it is sent downstream to other processes over either HTTP or messaging.
Provides a way to create or continue spans and add tags and logs through annotations.
If
spring-cloud-sleuth-zipkinis on the classpath, the app generates and collects Zipkin-compatible traces. By default, it sends them over HTTP to a Zipkin server on localhost (port 9411). You can configure the location of the service by settingspring.zipkin.baseUrl.If you depend on
spring-rabbitorspring-kafka, your app sends traces to a broker instead of HTTP. **
Caution | spring-cloud-sleuth-stream is deprecated and should no longer be used. |
Spring Cloud Sleuth is OpenTracing compatible.
Important | If you use Zipkin, configure the probability of spans exported by setting spring.sleuth.sampler.probability (default: 0.1, which is 10 percent). Otherwise, you might think that Sleuth is not working be cause it omits some spans. |
Note | The SLF4J MDC is always set and logback users immediately see the trace and span IDs in logs per the example shown earlier. Other logging systems have to configure their own formatter to get the same result. The default is as follows: logging.pattern.level set to %5p [${spring.zipkin.service.name:${spring.application.name:-}},%X{X-B3-TraceId:-},%X{X-B3-SpanId:-},%X{X-Span-Export:-}] (this is a Spring Boot feature for logback users). If you do not use SLF4J, this pattern is NOT automatically applied. |
Building
Basic Compile and Test
To build the source you will need to install JDK 1.7.
Spring Cloud uses Maven for most build-related activities, and you should be able to get off the ground quite quickly by cloning the project you are interested in and typing
$ ./mvnw install
Note | You can also install Maven (>=3.3.3) yourself and run the mvn command in place of ./mvnw in the examples below. If you do that you also might need to add -P spring if your local Maven settings do not contain repository declarations for spring pre-release artifacts. |
Note | Be aware that you might need to increase the amount of memory available to Maven by setting a MAVEN_OPTSenvironment variable with a value like -Xmx512m -XX:MaxPermSize=128m. We try to cover this in the .mvnconfiguration, so if you find you have to do it to make a build succeed, please raise a ticket to get the settings added to source control. |
For hints on how to build the project look in .travis.yml if there is one. There should be a "script" and maybe "install" command. Also look at the "services" section to see if any services need to be running locally (e.g. mongo or rabbit). Ignore the git-related bits that you might find in "before_install" since they’re related to setting git credentials and you already have those.
The projects that require middleware generally include a docker-compose.yml, so consider using Docker Compose to run the middeware servers in Docker containers. See the README in the scripts demo repository for specific instructions about the common cases of mongo, rabbit and redis.
Note | If all else fails, build with the command from .travis.yml (usually ./mvnw install). |
Documentation
The spring-cloud-build module has a "docs" profile, and if you switch that on it will try to build asciidoc sources fromsrc/main/asciidoc. As part of that process it will look for a README.adoc and process it by loading all the includes, but not parsing or rendering it, just copying it to ${main.basedir} (defaults to ${basedir}, i.e. the root of the project). If there are any changes in the README it will then show up after a Maven build as a modified file in the correct place. Just commit it and push the change.
Working with the code
If you don’t have an IDE preference we would recommend that you use Spring Tools Suite or Eclipse when working with the code. We use the m2eclipse eclipse plugin for maven support. Other IDEs and tools should also work without issue as long as they use Maven 3.3.3 or better.
Importing into eclipse with m2eclipse
We recommend the m2eclipse eclipse plugin when working with eclipse. If you don’t already have m2eclipse installed it is available from the "eclipse marketplace".
Note | Older versions of m2e do not support Maven 3.3, so once the projects are imported into Eclipse you will also need to tell m2eclipse to use the right profile for the projects. If you see many different errors related to the POMs in the projects, check that you have an up to date installation. If you can’t upgrade m2e, add the "spring" profile to your settings.xml. Alternatively you can copy the repository settings from the "spring" profile of the parent pom into your settings.xml. |
Importing into eclipse without m2eclipse
If you prefer not to use m2eclipse you can generate eclipse project metadata using the following command:
$ ./mvnw eclipse:eclipse
The generated eclipse projects can be imported by selecting import existing projects from the file menu.
Important | Spring Cloud Sleuth uses two different versions of language level. Java 1.7 is used for main sources, and Java 1.8 is used for tests. When importing your project to an IDE, you should activate the ide Maven profile to turn on Java 1.8 for both main and test sources. You MUST NOT use Java 1.8 features in the main sources. If you do so, your app breaks during the Maven build. |
Contributing
Spring Cloud is released under the non-restrictive Apache 2.0 license, and follows a very standard Github development process, using Github tracker for issues and merging pull requests into master. If you want to contribute even something trivial please do not hesitate, but follow the guidelines below.
Sign the Contributor License Agreement
Before we accept a non-trivial patch or pull request we will need you to sign the Contributor License Agreement. Signing the contributor’s agreement does not grant anyone commit rights to the main repository, but it does mean that we can accept your contributions, and you will get an author credit if we do. Active contributors might be asked to join the core team, and given the ability to merge pull requests.
Code of Conduct
This project adheres to the Contributor Covenant code of conduct. By participating, you are expected to uphold this code. Please report unacceptable behavior to spring-code-of-conduct@pivotal.io.
Code Conventions and Housekeeping
None of these is essential for a pull request, but they will all help. They can also be added after the original pull request but before a merge.
Use the Spring Framework code format conventions. If you use Eclipse you can import formatter settings using the
eclipse-code-formatter.xmlfile from the Spring Cloud Build project. If using IntelliJ, you can use the Eclipse Code Formatter Plugin to import the same file.Make sure all new
.javafiles to have a simple Javadoc class comment with at least an@authortag identifying you, and preferably at least a paragraph on what the class is for.Add the ASF license header comment to all new
.javafiles (copy from existing files in the project)Add yourself as an
@authorto the .java files that you modify substantially (more than cosmetic changes).Add some Javadocs and, if you change the namespace, some XSD doc elements.
A few unit tests would help a lot as well — someone has to do it.
If no-one else is using your branch, please rebase it against the current master (or other target branch in the main project).
When writing a commit message please follow these conventions, if you are fixing an existing issue please add
Fixes gh-XXXXat the end of the commit message (where XXXX is the issue number).