前言:
上一节中,我们使用Hystrix Dashboard,只能看到单个应用内的服务信息。在生产环境中,我们经常是集群状态,所以我们需要用到Turbine这一应用。
作用:汇总系统内的多个服务的数据并显示到Hystrix Dashboard上。
1. 新建Turbine项目
添加依赖,pom文件
 <dependency>
            <groupId>org.springframework.boot</groupId>
            <artifactId>spring-boot-starter-actuator</artifactId>
        </dependency>
        <dependency>
            <groupId>org.springframework.cloud</groupId>
            <artifactId>spring-cloud-starter-netflix-eureka-server</artifactId>
        </dependency>
        <dependency>
            <groupId>org.springframework.cloud</groupId>
            <artifactId>spring-cloud-starter-netflix-turbine</artifactId>
        </dependency>
2. 配置文件
# server
server.port=9998

# spring
spring.application.name=spring-cloud-turbine

# eureka
#eureka.client.serviceUrl.defaultZone=http://localhost:8761/eureka/


# info自定义
info.build.name=@project.name@
info.build.description=@project.description@
info.build.groupId=@project.groupId@
info.build.artifact=@project.artifactId@
info.build.version=@project.version@

eureka.instance.status-page-url-path=/info
eureka.instance.instanceId=${spring.application.name}:${random.value}
eureka.instance.prefer-ip-address=true

#设置拉取服务注册信息时间,默认60s
eureka.client.registry-fetch-interval-seconds=30

#指定续约更新频率,默认是30s
eureka.instance.lease-renewal-interval-in-seconds=15

#设置过期剔除时间,默认90s
eureka.instance.lease-expiration-duration-in-seconds=45

# turbine(说明:注意必须为大写,因为eureka返回的值都是大写的)
turbine.aggregator.clusterConfig=SPRING-CLOUD-CONSUMER
turbine.app-config=spring-cloud-consumer
在项目启动类中添加@EnableTurbine注解。
3. 修改消费者servlet的映射路径
在2.x中,所有监控都会带上actuator根路径,所以我们需要修改消费者中HystrixMetricsStreamServlet注册时的映射路径,如下:
将原来的/hystrix.stream修改为/actuator/hystrix.stream即可
 /**
     * 配置Hystrix.stream的servlet
     * @return
     */
    @Bean
    public ServletRegistrationBean registrationBean() {
        HystrixMetricsStreamServlet streamServlet = new HystrixMetricsStreamServlet();
        ServletRegistrationBean registrationBean = new ServletRegistrationBean(streamServlet);
        registrationBean.setLoadOnStartup(1);
        registrationBean.addUrlMappings("/actuator/hystrix.stream");
        registrationBean.setName("HystrixMetricsStreamServlet");
        return registrationBean;
    }
4. 测试:如何监控一个集群应用
1. 启动三个不同端口的SPRING-CLOUD-CONSUMER.
2. 访问http://localhost:9999/hystrix
同时要监控9996,9997,9999三个端口
方法一:
分别加入http://localhost:9996/actuator/hystrix.stream,http://localhost:9997/actuator/hystrix.stream,http://localhost:9999/actuator/hystrix.stream三个路径。
方法二:
加入:http://localhost:9998/turbine.stream?cluster=SPRING-CLOUD-CONSUMER
说明:其中cluster对应配置文件中的clusterConfig的名称
3. 访问三个端口对应的服务,查看dashboard如下
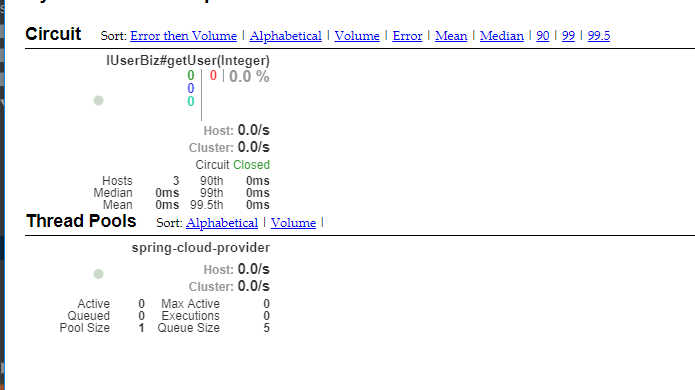
这里有一个服务的断路器策略是线程池熔断策略,所以会显示线程池的信息。
5. 如何监控多个集群
1.在turbine中注释掉之前的配置,添加新的配置
turbine.aggregator.clusterConfig=WANGX
turbine.app-config=spring-cloud-consumer,spring-cloud-consumer2
turbine.cluster-name-expression=metadata['cluster']
turbine.combine-host-port=true
2. 在消费者中添加配置
eureka.instance.metadata-map.cluster=WANGX
在http://localhost:9999/hystrix中加入http://localhost:9998/turbine.stream?cluster=WANGX
此时会检测所有添加了数据源cluster的服务
6. 测试:监控全部应用
1. 在turbine中添加修改配置
保留
turbine.app-config=spring-cloud-consumer,spring-cloud-consumer2
修改
turbine.cluster-name-expression="default"
注释掉turbine.aggregator.clusterConfig=WANGX
#turbine.aggregator.clusterConfig=WANGX
在http://localhost:9999/hystrix中添加http://localhost:9998/turbine.stream
这样就可以对全部应用进行监控
原文 SpringCloud学习笔记(16)----Spring Cloud Netflix之Hystrix Dashboard+Turbine集群监控